Here we can Discuss Per capita income in India before that take a look at GDP. The Gross Domestic Product at constant (2011-12) prices for the year 2019 is at ₹ 140.78 lakh crore, as against ₹ 131.80 lakh crore for 2017-18, indicating growth of 6.8 percent during 2018-19. At current prices, GDP for 2018-19 is ₹ 190.10 lakh crore as against ₹ 170.95 lakh crore for 2017-18, showing an increase of 11.2 percent during the year.
GDP- Gross Domestic Product
What is Per Capita Income Meaning and Definition
Meaning of Per Capita is the Average income Earned Per Person in the Specified Area ( Eg Country, States, etc). The formula to Calculate Per Capita is the Total income of the Specified Area Divided by the number of Population in that specified area. Read the Below Article to Get More Information About India Per Capital Income.
Example
Here Per capita Income of India is Derived from National Income and Population of India.
- India National Income 2019 = ₹ 123.30 lakh crore
- Population of India = 134 Billion
- Per Cap income 2019 = ₹ 1, 26,406
Lower Per capita Indicate that there is Lot of Growth left in that Particular Country
Normally Developed Countries like the US, Japan, Europe, etc have high per capita income. Developing countries like India, Africa, China, etc have low per capita income indicating that there is lot of growth left in the country. Highly Populated Country tends to have low per capita income due to inverse relation.
Related Posts

India National Income
National Income (i.e. Net National Income) at constant (2011- 12) prices for 2018-19 is ₹ 123.30 lakh crore, as against the estimate of ₹ 115.31 lakh crore for 2017-18, showing a rise of 6.9 percent during 2018-19. At current prices, the National Income for 2018-19 is at ₹ 168.37 lakh crore as compared to ₹ 151.28 lakh crore for 2017-18, showing a rise of 11.3 percent during the year.
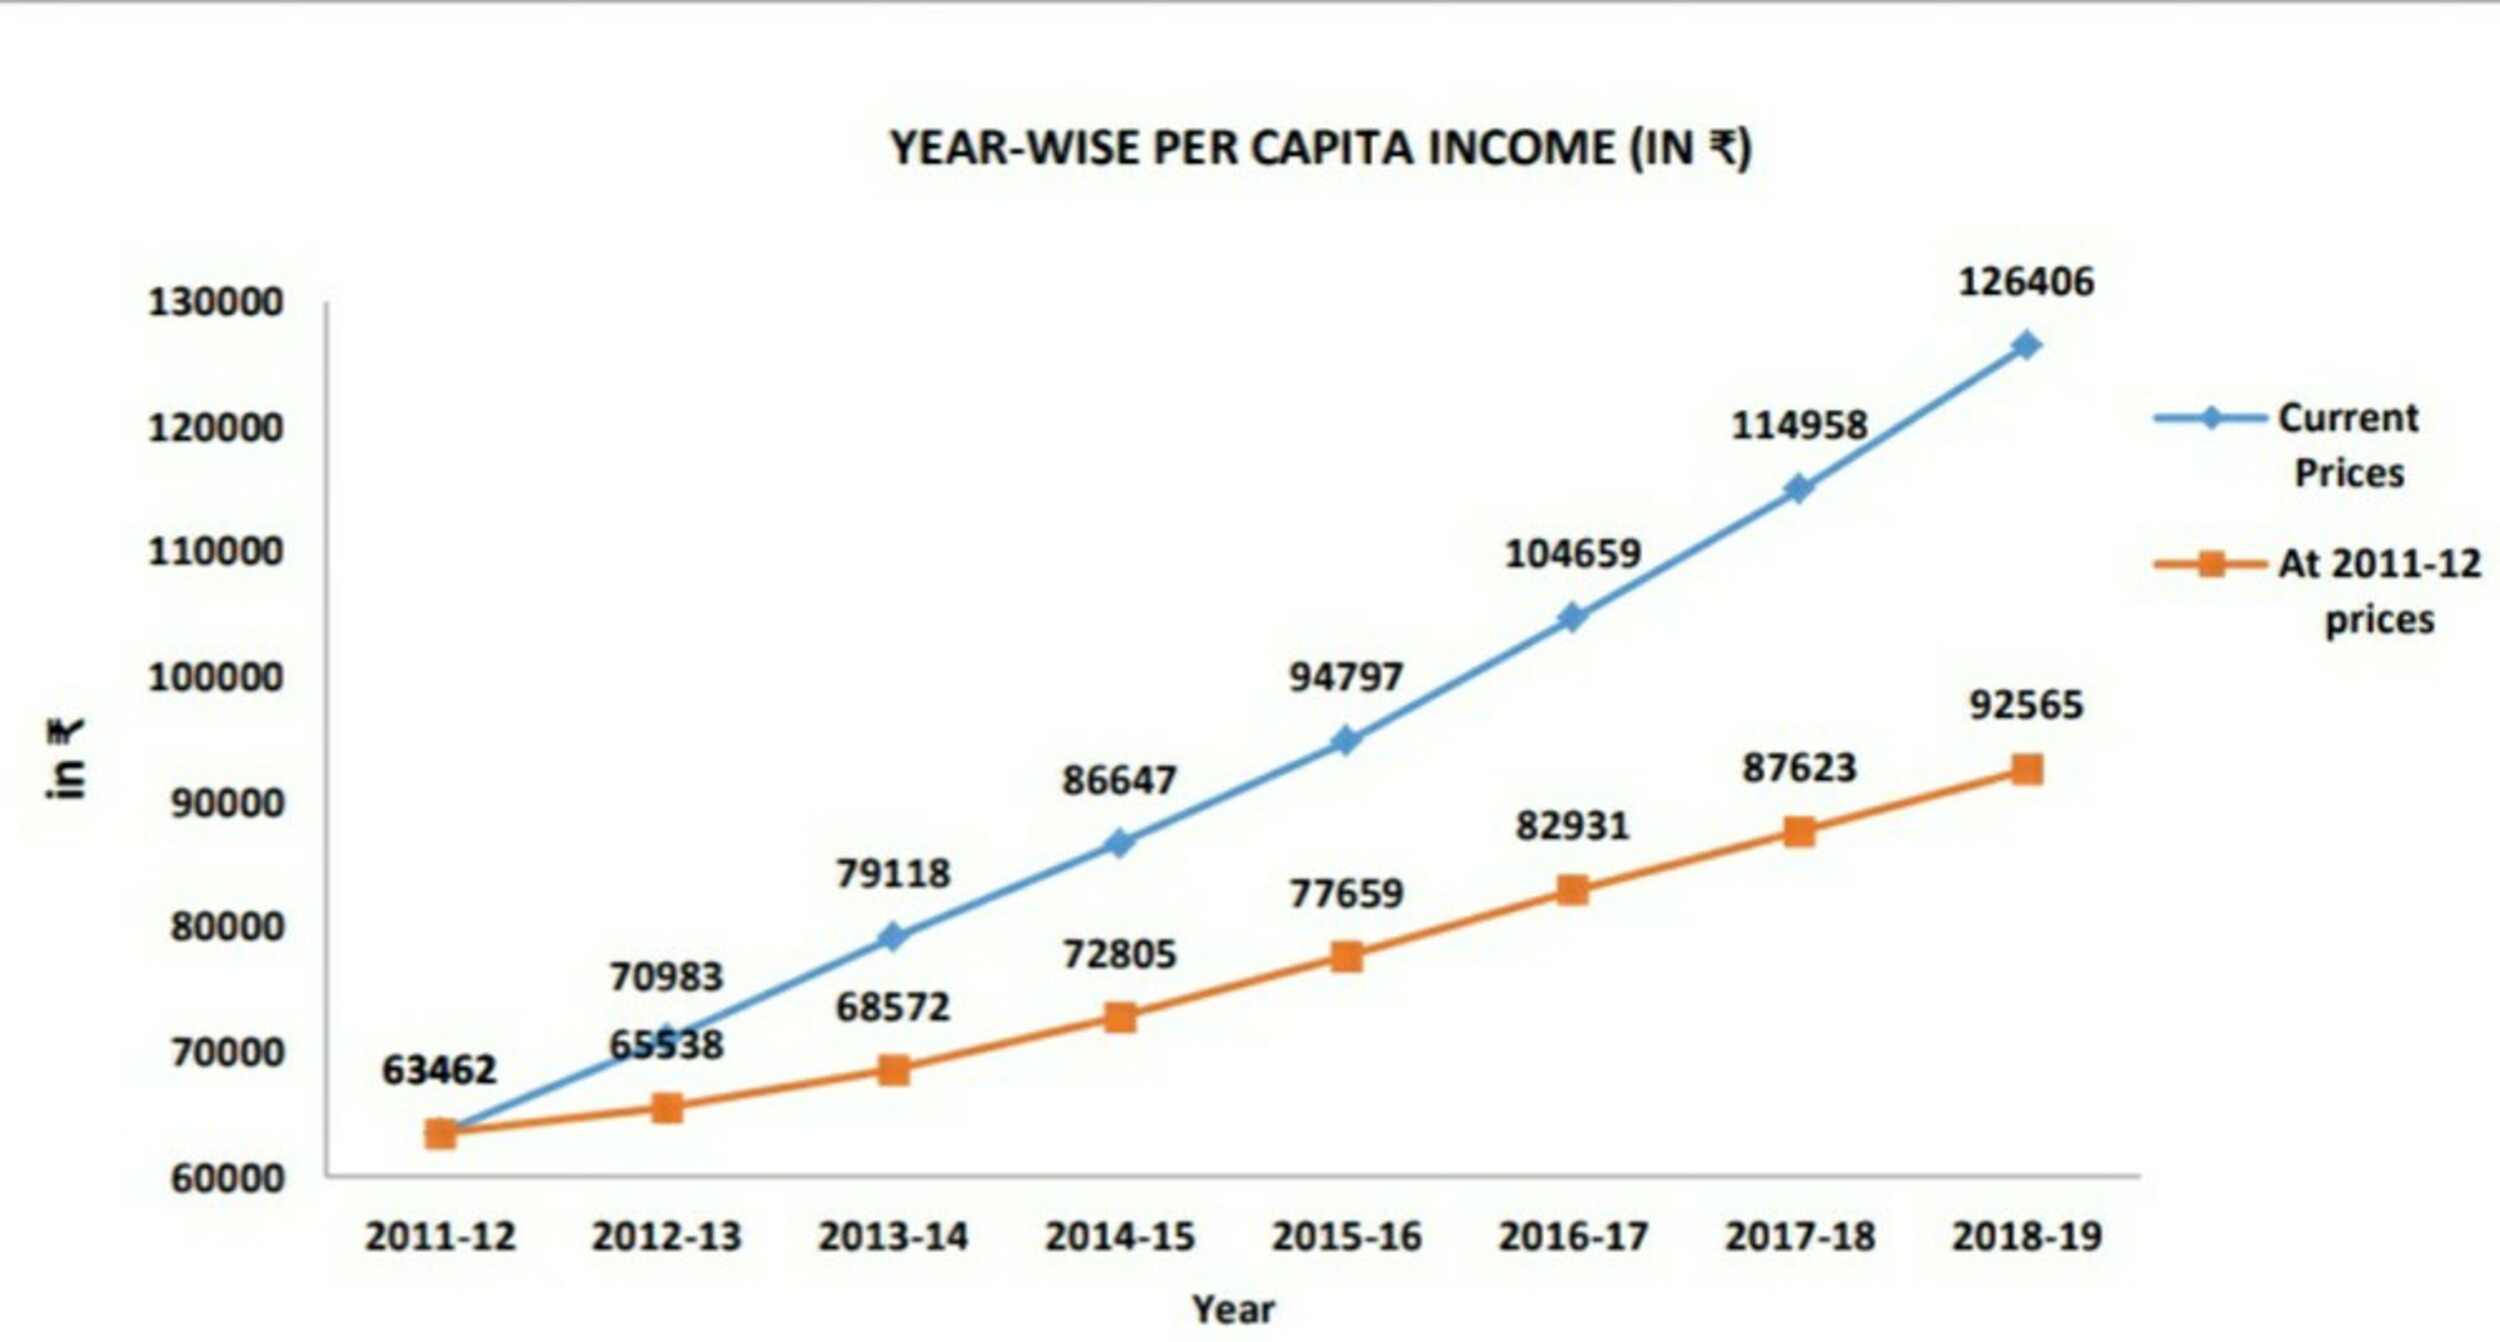
Here is the Graph Shows Per Capita income in From the year 2011 to 2019. There is a steady increase in Per capita from Rs 63,461 in The year 2011 to Rs 1,26,406 in 2019. This Graph Shows both current Prices and Price at 2011-12.
Income Per Capita India
The per capita real income, i.e. per capita net national income at constant (2011- 12) prices, for 2018-19 is at ₹ 92,565 as against ₹ 87,623 for 2017-18. This indicates a growth of per capita real income of 5.6 percent during 2018- 19. The per capita income at current prices during 2018-19 is at ₹ 1, 26,406 as compared to ₹ 1, 14,958 in 2017-18 showing a rise of 10.0 percent.
India State Per Capita income
Here is the table that shows per capita income for all states and union territories with Gross State Domestic Product (GSDP). This table also shows GPD growth for every state in India in the last column of the table. Per capita income is shown both in terms of Current Prices and At Constant Prices
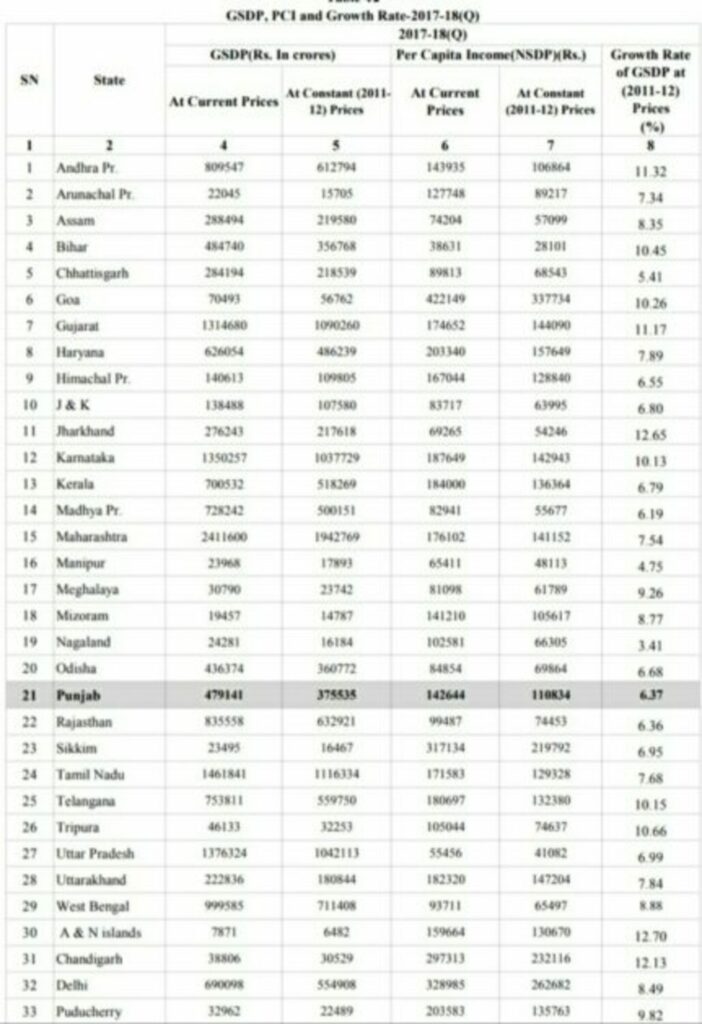
- GSDP- Gross State Domestic Product
- PCI- Per Capita Income
Highest Income State in India [ Richest state in india 2020 ]
Goa is the Highest per capita income state in India with a per capita income of Rs 4,22,149. The per capita income of Goa is three times of National Per Capita. Capital Delhi is 2nd Highest per capita income state in India with an income of Rs 3,28,985. North East state Sikkim is at 3rd followed by Chandigarh and Haryana.
So finally Goa is the richest state in India in terms of per capita income and Delhi is the second richest. It is also currently the richest state in India 2020
Lowest income states in India
Bihar is the lowest per capita income state in India with a per capita income of Rs 38,631. The per capita income of Goa is eleven times of Bihar Per Capita. Uttar Pratesh is 2nd lowest per capita income state in India with an income of Rs 55,456. Bihar Per capita is 3 times lower than national per capita.
So finally Bihar is the Lowest per capita income state in India.
State Wise Per Capita | Per Capita income of Indian States
The following are the Table that shows Per Capita income of Indian states by growth for last five years.
| Andhra Pradesh ** | ||
| PER CAPITA NSDP CURRENT | Growth (%) | |
| 2011-12 | 69000 | |
| 2012-13 | 74687 | 8.2 |
| 2013-14 | 82870 | 11.0 |
| 2014-15 | 93699 | 13.1 |
| 2015-16 | 108163 | 15.4 |
| 2016-17 | 122376 | 13.1 |
| Arunachal Pradesh | ||
| PER CAPITA NSDP CURRENT | Growth (%) | |
| 2011-12 | 73068 | |
| 2012-13 | 81353 | 11.3 |
| 2013-14 | 91803 | 12.8 |
| 2014-15 | 110912 | 20.8 |
| 2015-16 | 112312 | 1.3 |
| 2016-17 | 119481 | 6.4 |
| Assam | ||
| PER CAPITA NSDP CURRENT | Growth (%) | |
| 2011-12 | 41142 | |
| 2012-13 | 44599 | 8.4 |
| 2013-14 | 49734 | 11.5 |
| 2014-15 | 52895 | 6.4 |
| 2015-16 | 60817 | 15.0 |
| 2016-17 | 67303 | 10.7 |
| Bihar | ||
| PER CAPITA NSDP CURRENT | Growth (%) | |
| 2011-12 | 21750 | |
| 2012-13 | 24487 | 12.6 |
| 2013-14 | 26948 | 10.1 |
| 2014-15 | 28671 | 6.4 |
| 2015-16 | 30213 | 5.4 |
| 2016-17 | 34409 | 13.9 |
| 2017-18 | 38860 | 12.9 |
| Chhattisgarh | ||
| PER CAPITA NSDP CURRENT | Growth (%) | |
| 2011-12 | 55177 | |
| 2012-13 | 60849 | 10.3 |
| 2013-14 | 69880 | 14.8 |
| 2014-15 | 72946 | 4.4 |
| 2015-16 | 76025 | 4.2 |
| 2016-17 | 84265 | 10.8 |
| 2017-18 | 92035 | 9.2 |
| Goa * | ||
| PER CAPITA NSDP CURRENT | Growth (%) | |
| 2011-12 | 259444 | |
| 2012-13 | 234354 | -9.7 |
| 2013-14 | 215776 | -7.9 |
| 2014-15 | 289185 | 34.0 |
| 2015-16 | 334576 | 15.7 |
| 2016-17 | 375554 | 12.2 |
| Gujarat | ||
| PER CAPITA NSDP CURRENT | Growth (%) | |
| 2011-12 | 87481 | |
| 2012-13 | 102826 | 17.5 |
| 2013-14 | 113139 | 10.0 |
| 2014-15 | 127017 | 12.3 |
| 2015-16 | 139254 | 9.6 |
| 2016-17 | 156527 | 12.4 |
| Haryana ** | ||
| PER CAPITA NSDP CURRENT | Growth (%) | |
| 2011-12 | 106085 | |
| 2012-13 | 121269 | 14.3 |
| 2013-14 | 138300 | 14.0 |
| 2014-15 | 148485 | 7.4 |
| 2015-16 | 162034 | 9.1 |
| 2016-17 | 180174 | 11.2 |
| Himachal Pradesh | ||
| PER CAPITA NSDP CURRENT | Growth (%) | |
| 2011-12 | 87721 | |
| 2012-13 | 99730 | 13.7 |
| 2013-14 | 114095 | 14.4 |
| 2014-15 | 123299 | 8.1 |
| 2015-16 | 135512 | 9.9 |
| 2016-17 | 150285 | 10.9 |
| 2017-18 | 160719 | 6.9 |
| Jammu & Kashmir | ||
| PER CAPITA NSDP CURRENT | Growth (%) | |
| 2011-12 | 53173 | |
| 2012-13 | 56828 | 6.9 |
| 2013-14 | 61108 | 7.5 |
| 2014-15 | 61213 | 0.2 |
| 2015-16 | 73229 | 19.6 |
| 2016-17 | 78163 | 6.7 |
| Jharkhand | ||
| PER CAPITA NSDP CURRENT | Growth (%) | |
| 2011-12 | 41254 | |
| 2012-13 | 47360 | 14.8 |
| 2013-14 | 50006 | 5.6 |
| 2014-15 | 57301 | 14.6 |
| 2015-16 | 52754 | -7.9 |
| 2016-17 | 59799 | 13.4 |
| 2017-18 | 63754 | 6.6 |
| Karnataka ** | ||
| PER CAPITA NSDP CURRENT | Growth (%) | |
| 2011-12 | 90263 | |
| 2012-13 | 102319 | 13.4 |
| 2013-14 | 118829 | 16.1 |
| 2014-15 | 129823 | 9.3 |
| 2015-16 | 142267 | 9.6 |
| 2016-17 | 157436 | 10.7 |
| 2017-18 | 174551 | 10.9 |
| Kerala | ||
| PER CAPITA NSDP CURRENT | Growth (%) | |
| 2011-12 | 97912 | |
| 2012-13 | 110314 | 12.7 |
| 2013-14 | 123388 | 11.9 |
| 2014-15 | 135537 | 9.8 |
| 2015-16 | 148011 | 9.2 |
| 2016-17 | 163475 | 10.4 |
| Madhya Pradesh | ||
| PER CAPITA NSDP CURRENT | Growth (%) | |
| 2011-12 | 38551 | |
| 2012-13 | 44931 | 16.6 |
| 2013-14 | 52129 | 16.0 |
| 2014-15 | 56069 | 7.6 |
| 2015-16 | 62817 | 12.0 |
| 2016-17 | 74590 | 18.7 |
| Maharashtra | ||
| PER CAPITA NSDP CURRENT | Growth (%) | |
| 2011-12 | 99564 | |
| 2012-13 | 111980 | 12.5 |
| 2013-14 | 125039 | 11.7 |
| 2014-15 | 132611 | 6.1 |
| 2015-16 | 147610 | 11.3 |
| 2016-17 | 165491 | 12.1 |
| 2017-18 | 180596 | 9.1 |
| Manipur | ||
| PER CAPITA NSDP CURRENT | Growth (%) | |
| 2011-12 | 39762 | |
| 2012-13 | 41230 | 3.7 |
| 2013-14 | 47798 | 15.9 |
| 2014-15 | 52717 | 10.3 |
| 2015-16 | 55447 | 5.2 |
| 2016-17 | 58501 | 5.5 |
| Meghalaya | ||
| PER CAPITA NSDP CURRENT | Growth (%) | |
| 2011-12 | 60013 | |
| 2012-13 | 64036 | 6.7 |
| 2013-14 | 65118 | 1.7 |
| 2014-15 | 64638 | -0.7 |
| 2015-16 | 68836 | 6.5 |
| 2016-17 | 73291 | 6.5 |
| Mizoram | ||
| PER CAPITA NSDP CURRENT | Growth (%) | |
| 2011-12 | 57654 | |
| 2012-13 | 65013 | 12.8 |
| 2013-14 | 77584 | 19.3 |
| 2014-15 | 103049 | 32.8 |
| 2015-16 | 114055 | 10.7 |
| 2016-17 | 128998 | 13.1 |
| Nagaland | ||
| PER CAPITA NSDP CURRENT | Growth (%) | |
| 2011-12 | 53010 | |
| 2012-13 | 61225 | 15.5 |
| 2013-14 | 71510 | 16.8 |
| 2014-15 | 78367 | 9.6 |
| 2015-16 | 82466 | 5.2 |
| 2016-17 | 90168 | 9.3 |
| Odisha ** | ||
| PER CAPITA NSDP CURRENT | Growth (%) | |
| 2011-12 | 48370 | |
| 2012-13 | 54703 | 13.1 |
| 2013-14 | 60574 | 10.7 |
| 2014-15 | 63173 | 4.3 |
| 2015-16 | 65650 | 3.9 |
| 2016-17 | 74234 | 13.1 |
| 2017-18 | 80991 | 9.1 |
| Punjab | ||
| PER CAPITA NSDP CURRENT | Growth (%) | |
| 2011-12 | 85577 | |
| 2012-13 | 94318 | 10.2 |
| 2013-14 | 103831 | 10.1 |
| 2014-15 | 108970 | 4.9 |
| 2015-16 | 118858 | 9.1 |
| 2016-17 | 128890 | 8.4 |
| Rajasthan ** | ||
| PER CAPITA NSDP CURRENT | Growth (%) | |
| 2011-12 | 57192 | |
| 2012-13 | 63658 | 11.3 |
| 2013-14 | 69480 | 9.1 |
| 2014-15 | 76436 | 10.0 |
| 2015-16 | 83977 | 9.9 |
| 2016-17 | 92076 | 9.6 |
| 2017-18 | 100551 | 9.2 |
| Sikkim* | ||
| PER CAPITA NSDP CURRENT | Growth (%) | |
| 2011-12 | 158667 | |
| 2012-13 | 174183 | 9.8 |
| 2013-14 | 194624 | 11.7 |
| 2014-15 | 214148 | 10.0 |
| 2015-16 | 245987 | 14.9 |
| 2016-17 | 270572 | 10.0 |
| 2017-18 | 297765 | 10.0 |
| Tamil Nadu | ||
| PER CAPITA NSDP CURRENT | Growth (%) | |
| 2011-12 | 92984 | |
| 2012-13 | 104943 | 12.9 |
| 2013-14 | 116236 | 10.8 |
| 2014-15 | 128372 | 10.4 |
| 2015-16 | 140441 | 9.4 |
| 2016-17 | 150036 | 6.8 |
| 2017-18 | 166934 | 11.3 |
| Telangana | ||
| PER CAPITA NSDP CURRENT | Growth (%) | |
| 2011-12 | 91121 | |
| 2012-13 | 101007 | 10.8 |
| 2013-14 | 112162 | 11.0 |
| 2014-15 | 124104 | 10.6 |
| 2015-16 | 140840 | 13.5 |
| 2016-17 | 159856 | 13.5 |
| 2017-18 | 181034 | 13.2 |
| Tripura ** | ||
| PER CAPITA NSDP CURRENT | Growth (%) | |
| 2011-12 | 47079 | |
| 2012-13 | 52434 | 11.4 |
| 2013-14 | 61570 | 17.4 |
| 2014-15 | 63969 | 3.9 |
| 2015-16 | 80027 | 25.1 |
| Uttar Pradesh | ||
| PER CAPITA NSDP CURRENT | Growth (%) | |
| 2011-12 | 32002 | |
| 2012-13 | 35812 | 11.9 |
| 2013-14 | 40124 | 12.0 |
| 2014-15 | 42267 | 5.3 |
| 2015-16 | 47062 | 11.3 |
| 2016-17 | 51014 | 8.4 |
| 2017-18 | 55339 | 8.5 |
| Uttarakhand ** | ||
| PER CAPITA NSDP CURRENT | Growth (%) | |
| 2011-12 | 100305 | |
| 2012-13 | 113610 | 13.3 |
| 2013-14 | 126247 | 11.1 |
| 2014-15 | 135881 | 7.6 |
| 2015-16 | 146454 | 7.8 |
| 2016-17 | 161102 | 10.0 |
| 2017-18 | 177356 | 10.1 |
| West Bengal | ||
| PER CAPITA NSDP CURRENT | Growth (%) | |
| 2011-12 | 51543 | |
| 2012-13 | 58195 | 12.9 |
| 2013-14 | 65932 | 13.3 |
| 2014-15 | 68876 | 4.5 |
| 2015-16 | 75992 | 10.3 |
| 2016-17 | 83126 | 9.4 |
| 2017-18 | 95562 | 15.0 |
| Andaman & Nicobar Islands | ||
| PER CAPITA NSDP CURRENT | Growth (%) | |
| 2011-12 | 88177 | |
| 2012-13 | 96027 | 8.9 |
| 2013-14 | 106401 | 10.8 |
| 2014-15 | 119291 | 12.1 |
| 2015-16 | 126445 | 6.0 |
| 2016-17 | 136824 | 8.2 |
| Chandigarh | ||
| PER CAPITA NSDP CURRENT | Growth (%) | |
| 2011-12 | 159116 | |
| 2012-13 | 178549 | 12.2 |
| 2013-14 | 199135 | 11.5 |
| 2014-15 | 206760 | 3.8 |
| 2015-16 | 222710 | 7.7 |
| 2016-17 | 237599 | 6.7 |
| Delhi ** | ||
| PER CAPITA NSDP CURRENT | Growth (%) | |
| 2011-12 | 185361 | |
| 2012-13 | 206590 | 11.5 |
| 2013-14 | 229619 | 11.1 |
| 2014-15 | 249635 | 8.7 |
| 2015-16 | 271305 | 8.7 |
| 2016-17 | 300793 | 10.9 |
| 2017-18 | 329093 | 9.4 |
| Puducherry | ||
| PER CAPITA NSDP CURRENT | Growth (%) | |
| 2011-12 | 119649 | |
| 2012-13 | 130548 | 9.1 |
| 2013-14 | 148147 | 13.5 |
| 2014-15 | 146921 | -0.8 |
| 2015-16 | 172913 | 17.7 |
| 2016-17 | 185141 | 7.1 |
| 2017-18 | 198156 | 7.0 |