Here we discuss about Historical Inflation Rate In India, Average Inflation Rate from 1985-2021, Double Digit Inflation in India and Current Inflation percentage 2021.
Inflation in India
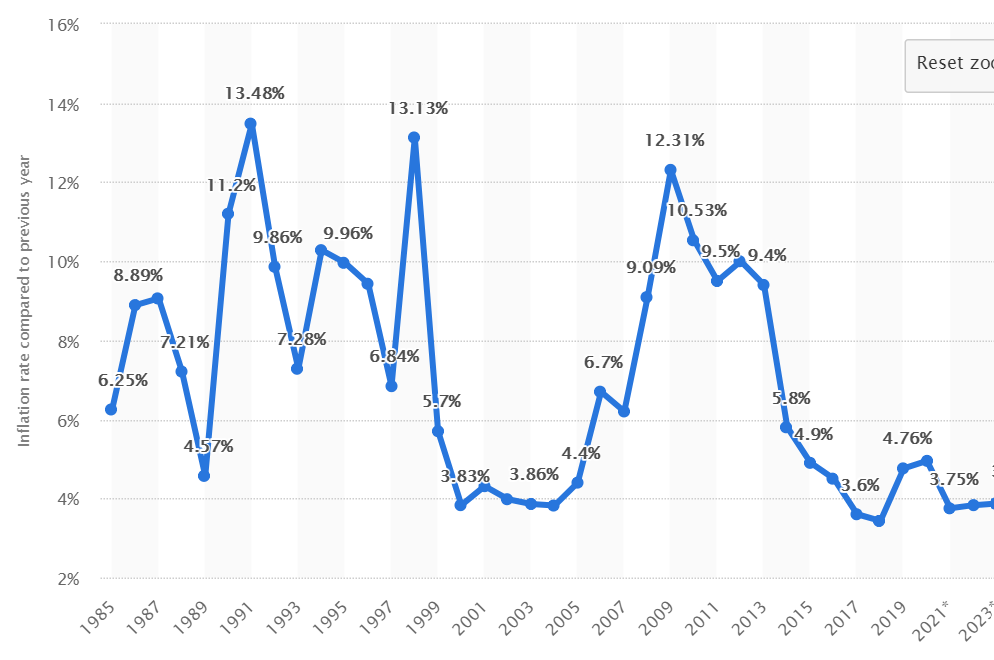
In Between 1985 to 2021 the inflation peaked at 13.48 % in the year 1991 and the inflation hit lowest in the year 2018 at inflation rate of 3.55%. The average inflation from 1985-2021 is 7.5%.
This is the chart that shows inflation rate from the year 1985 to 2021.

The inflation in India has been decreasing from one of the peak in the year 2009 till 2021. The great rise in inflation is happen between the year 2006 to 2009.
The below table shows inflation rate from 1960 to 2019.
| India Inflation Rate – Historical Data | ||
|---|---|---|
| Year | Inflation Rate (%) | Annual Change |
| 2019 | 7.66% | 2.80% |
| 2018 | 4.86% | 2.37% |
| 2017 | 2.49% | -2.45% |
| 2016 | 4.94% | -0.93% |
| 2015 | 5.87% | -0.48% |
| 2014 | 6.35% | -4.55% |
| 2013 | 10.91% | 1.60% |
| 2012 | 9.31% | 0.45% |
| 2011 | 8.86% | -3.13% |
| 2010 | 11.99% | 1.11% |
| 2009 | 10.88% | 2.53% |
| 2008 | 8.35% | 1.98% |
| 2007 | 6.37% | 0.58% |
| 2006 | 5.80% | 1.55% |
| 2005 | 4.25% | 0.48% |
| 2004 | 3.77% | -0.04% |
| 2003 | 3.81% | -0.49% |
| 2002 | 4.30% | 0.52% |
| 2001 | 3.78% | -0.23% |
| 2000 | 4.01% | -0.66% |
| 1999 | 4.67% | -8.56% |
| 1998 | 13.23% | 6.07% |
| 1997 | 7.16% | -1.81% |
| 1996 | 8.98% | -1.25% |
| 1995 | 10.22% | -0.02% |
| 1994 | 10.25% | 3.92% |
| 1993 | 6.33% | -5.46% |
| 1992 | 11.79% | -2.08% |
| 1991 | 13.87% | 4.90% |
| 1990 | 8.97% | 1.90% |
| 1989 | 7.07% | -2.31% |
| 1988 | 9.38% | 0.58% |
| 1987 | 8.80% | 0.07% |
| 1986 | 8.73% | 3.17% |
| 1985 | 5.56% | -2.76% |
| 1984 | 8.32% | -3.55% |
| 1983 | 11.87% | 3.98% |
| 1982 | 7.89% | -5.22% |
| 1981 | 13.11% | 1.77% |
| 1980 | 11.35% | 5.07% |
| 1979 | 6.28% | 3.75% |
| 1978 | 2.52% | -5.78% |
| 1977 | 8.31% | 15.94% |
| 1976 | -7.63% | -13.38% |
| 1975 | 5.75% | -22.85% |
| 1974 | 28.60% | 11.66% |
| 1973 | 16.94% | 10.50% |
| 1972 | 6.44% | 3.36% |
| 1971 | 3.08% | -2.01% |
| 1970 | 5.09% | 5.68% |
| 1969 | -0.58% | -3.82% |
| 1968 | 3.24% | -9.82% |
| 1967 | 13.06% | 2.26% |
| 1966 | 10.80% | 1.33% |
| 1965 | 9.47% | -3.88% |
| 1964 | 13.36% | 10.41% |
| 1963 | 2.95% | -0.69% |
| 1962 | 3.63% | 1.94% |
| 1961 | 1.70% | -0.08% |
| 1960 | 1.78% | -0.08% |
From the year 1960 to 2020 , the inflation peaked in the year 1974 at inflation rate of 28.6% which is highest inflation rate between the year 1960-2021. In the year 1976 the inflation hit the lowest level of -7.7% which is the lowest inflation rate between the year 1960-2021.
In the Past India has achieved double digit inflation rate in the
Current Inflation in India
Current Retail price inflation in India jumped to 5.03 percent in February of 2021 from 4.06 percent in January which is below the average inflation rate of 7.5 %. The Inflation in India in the future is expected to rise in the coming years.
Average Inflation Rates in India
The average Inflation in India from the year 1960 to 2021 is 7.55%. So on an average the Indian Currency is losing value at a rate of 7.5%.
- The average Inflation in India in the last five years is 5.16%.
- The average Inflation in the last 10 years is 7.32%
- and the average inflation from the year 2000 to 2020 is 6.4%
- In the last 3 years the average inflation in India is below 5%
Negative Inflation Rate in India [Deflation]
Deflation in India is the Negative Inflation in India. India has went through negative inflation [Deflation] in the past. In the year 1969 the annual inflation rate went negative rate of -0.58%. And in the year 1976 the annual Inflation rate in India is at -7.63 which is the lowest annual Inflation between the year 1960-2022.
Double Digit Rate in India
Between the year 2009 to 2013 the average inflation rate in India is 10.4 % and these five years the inflation rate is in double digit in almost every quarter.
In between the year 1991 to 1998 the average inflation rate in India stood at 10.3 % and in these years the inflation is also peaked about 15% in some months.
So finally on an average the Indian Rupee is losing its value at a rate of 8% year over year. So finally this is the end of the Research between the year 1960 to 2022.
Read more GDP per capita in India.


