IndianCompanies.in
  • BEST BRANDS
  • TOP COMPANIES
    • STEEL
    • FINANCIALS
    • TELECOM
    • PHARMA
    • AGRICULTURE
    • AUTOMOBILES
    • BANKING
    • HEALTHCARE
    • FMCG
  • STOCK MARKET INDEX
  • INDUSTRY
  • GROUP COMPANIES
    • COMPANY PROFILE
No Result
View All Result
IndianCompanies.in
  • BEST BRANDS
  • TOP COMPANIES
    • STEEL
    • FINANCIALS
    • TELECOM
    • PHARMA
    • AGRICULTURE
    • AUTOMOBILES
    • BANKING
    • HEALTHCARE
    • FMCG
  • STOCK MARKET INDEX
  • INDUSTRY
  • GROUP COMPANIES
    • COMPANY PROFILE
No Result
View All Result
IndianCompanies.in
No Result
View All Result
Home Indian Economy

Financial Crisis 2008 | Subprime Economic | Stock Market Crash

Raveendran R by Raveendran R
April 16, 2022
in Indian Economy
Reading Time: 4 mins read
0
Share on FacebookShare on Twitter

This article is about the Analysis of the Financial Crisis 2008 in India which happened over the period of 45 weaks subprime Crash. The Analysis was done in the Nifty 50 Index in the Weakly Chart.
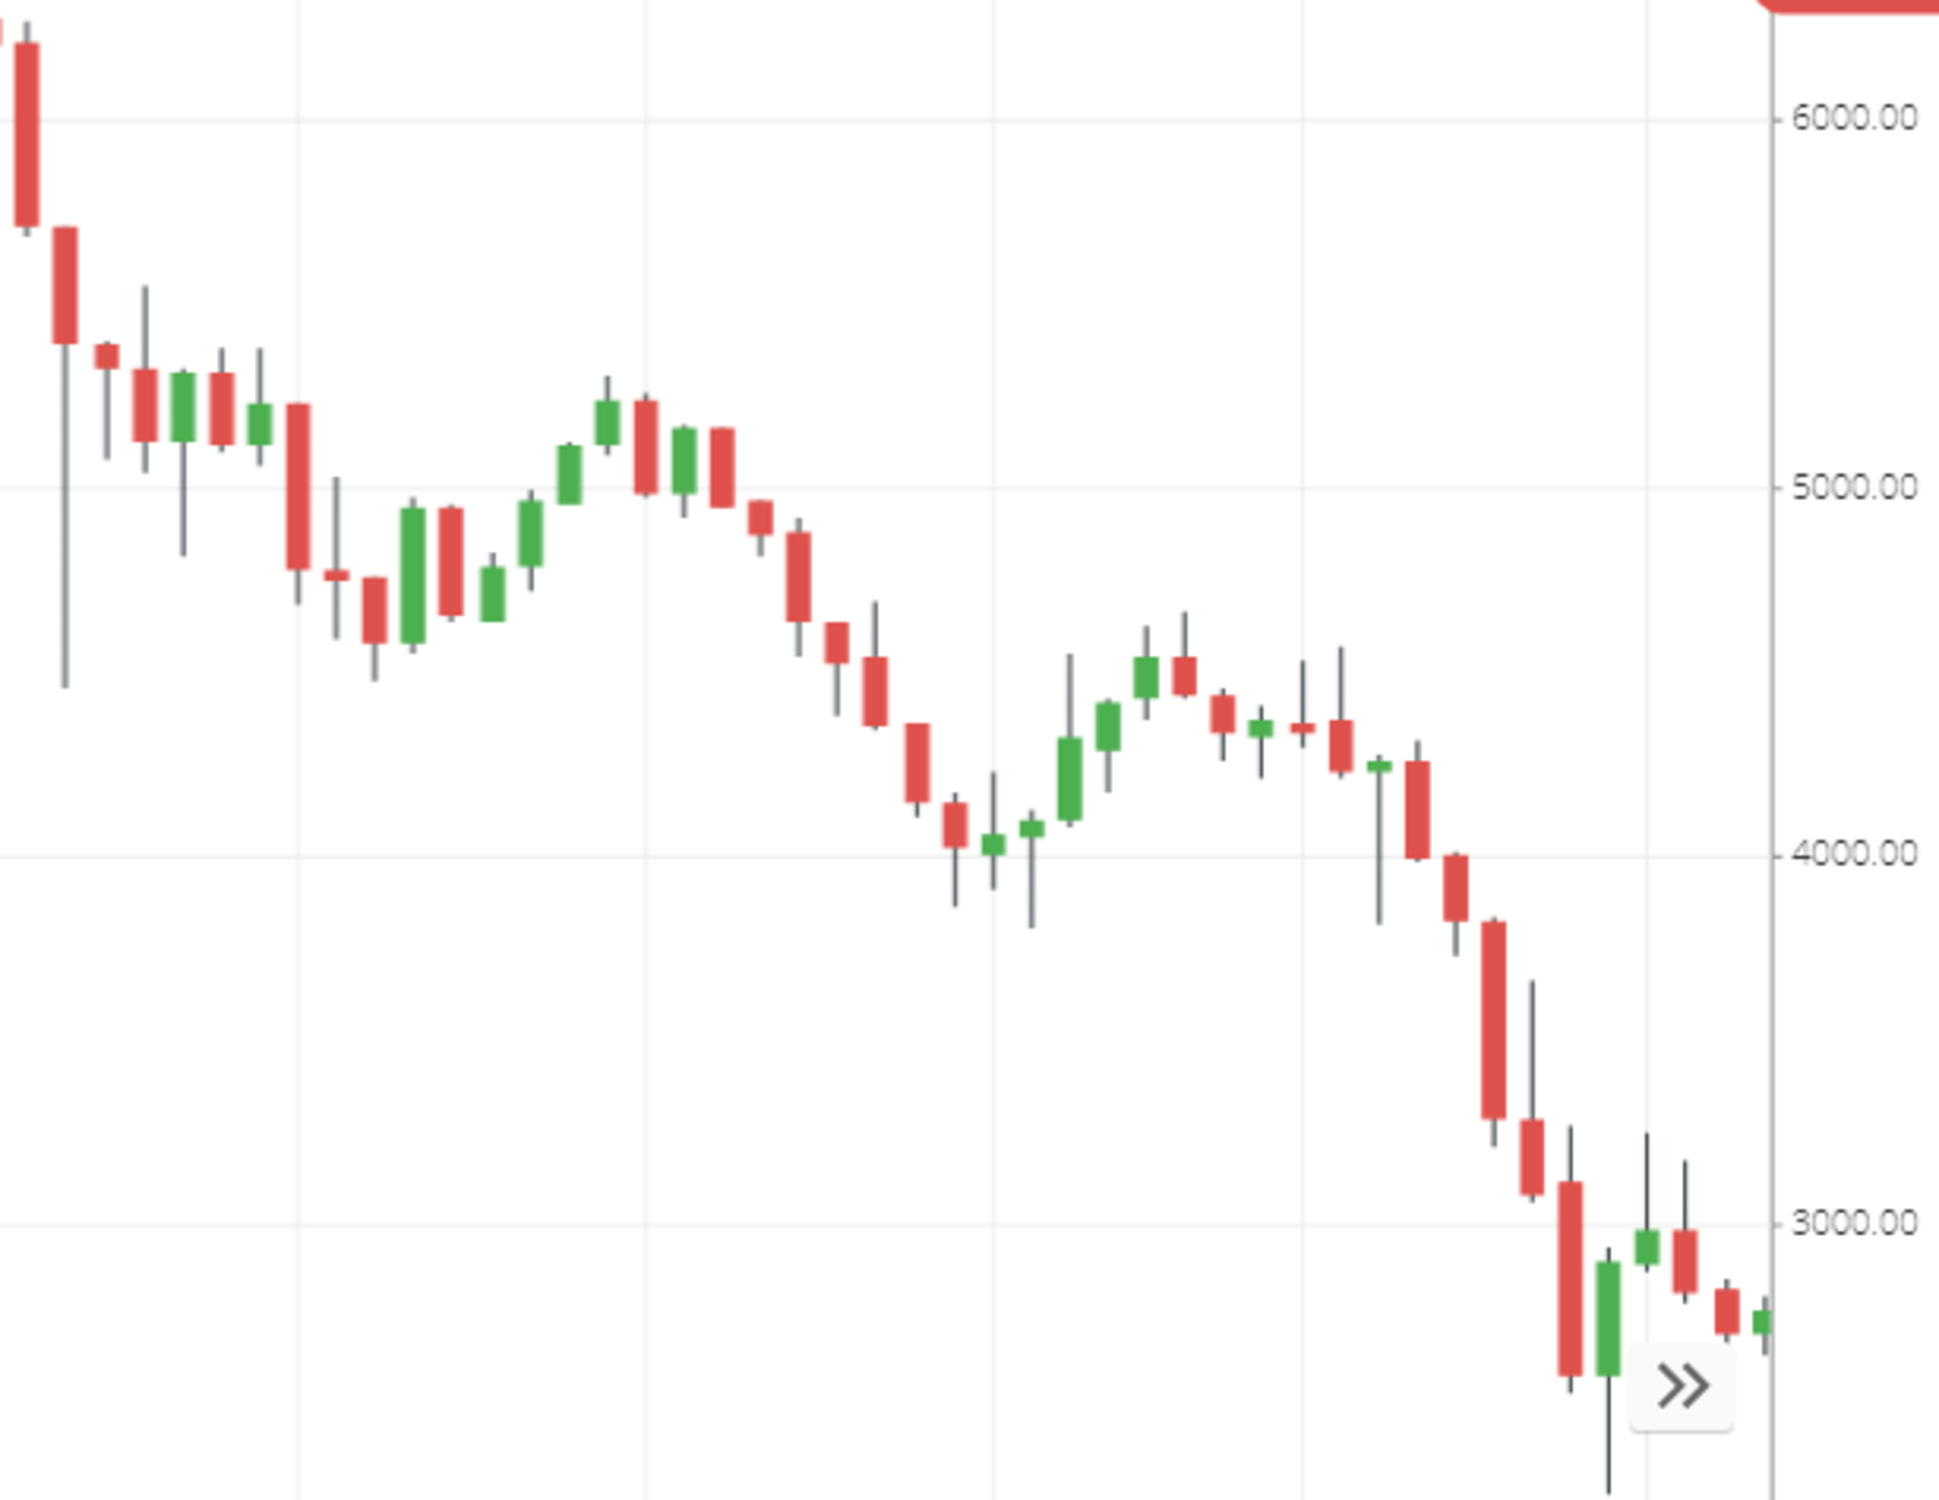
This Chart Shows there are Totaly 45 weakly Candlesticks are there. The Crisis happened in three phases. Each Phase takes 15 weeks as Shown in the Chart.

Maximum Fall in Financial Crisis 2008

During the Start of the Crisis, the Nifty index was trading at a price of around 6200 and after 45 weeks it was trading at around 2500.

The index has fallen nearly 60% in the period of 45 Weaks. As shown in the above Chart.

  • 1st Phase Fall: – 27.5 % Fall
  • 2nd Phase Fall: – 23.4 % Fall
  • 3rd Phase Fall: – 44.2% Fall

Let we Analysis each Phase in Detail

1st Phase Economic Crisis 2008

The 1st Phase was happed for a period of 15 weeks. For the First 10 Weaks, there is a continuous fall in nifty from 6200 to 4500 fall of nearly 27.5 %.

Related Posts

Nifty 50 Companies [Stocks weightage 2023]

October 8, 2023
Price Earning Ratio of Nifty 50 | Historical P B and P E

PE Ratio of Nifty 50 | 20 Years Historical Graph PB and PE

December 3, 2022

NIFTY Commodities Index | Stock weightage

April 16, 2022

BSE SENSEX 30 Companies | Stock Weightage

April 16, 2022

Listed Companies in NSE | List of Stocks 2022

September 27, 2022

Nifty Next 50 Index (Nifty 100 Stock Weightage)

April 16, 2022

In the next 5 weak there is a bounce of 15.5% from 4500 to 5200.
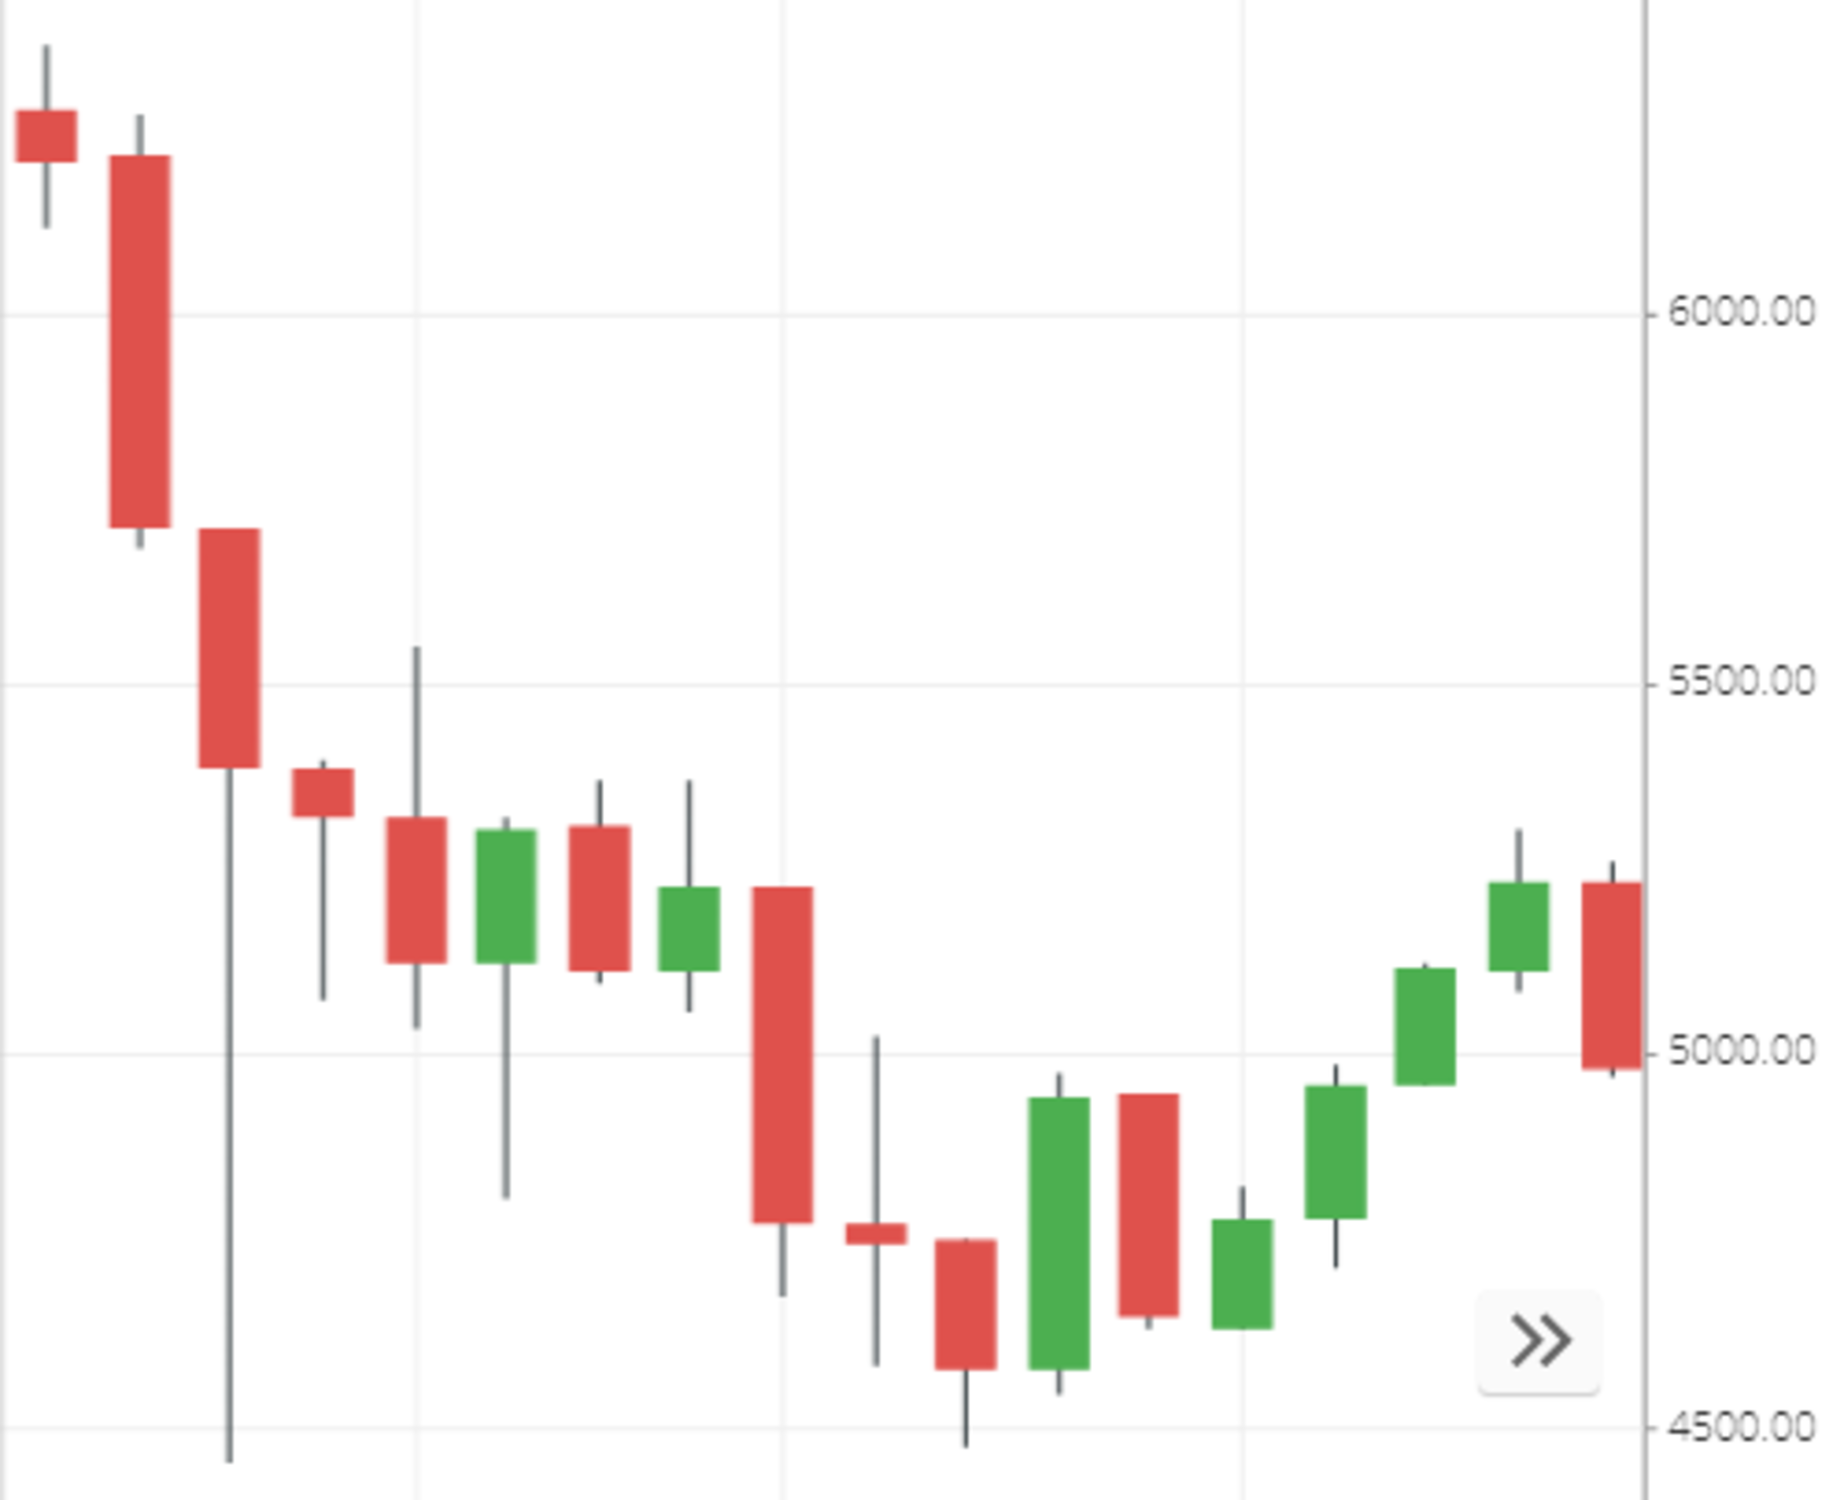
Economic Crisis

In the First 2 weak there is a Maximum Fall of 28%

2nd Phase Stock Market Crash

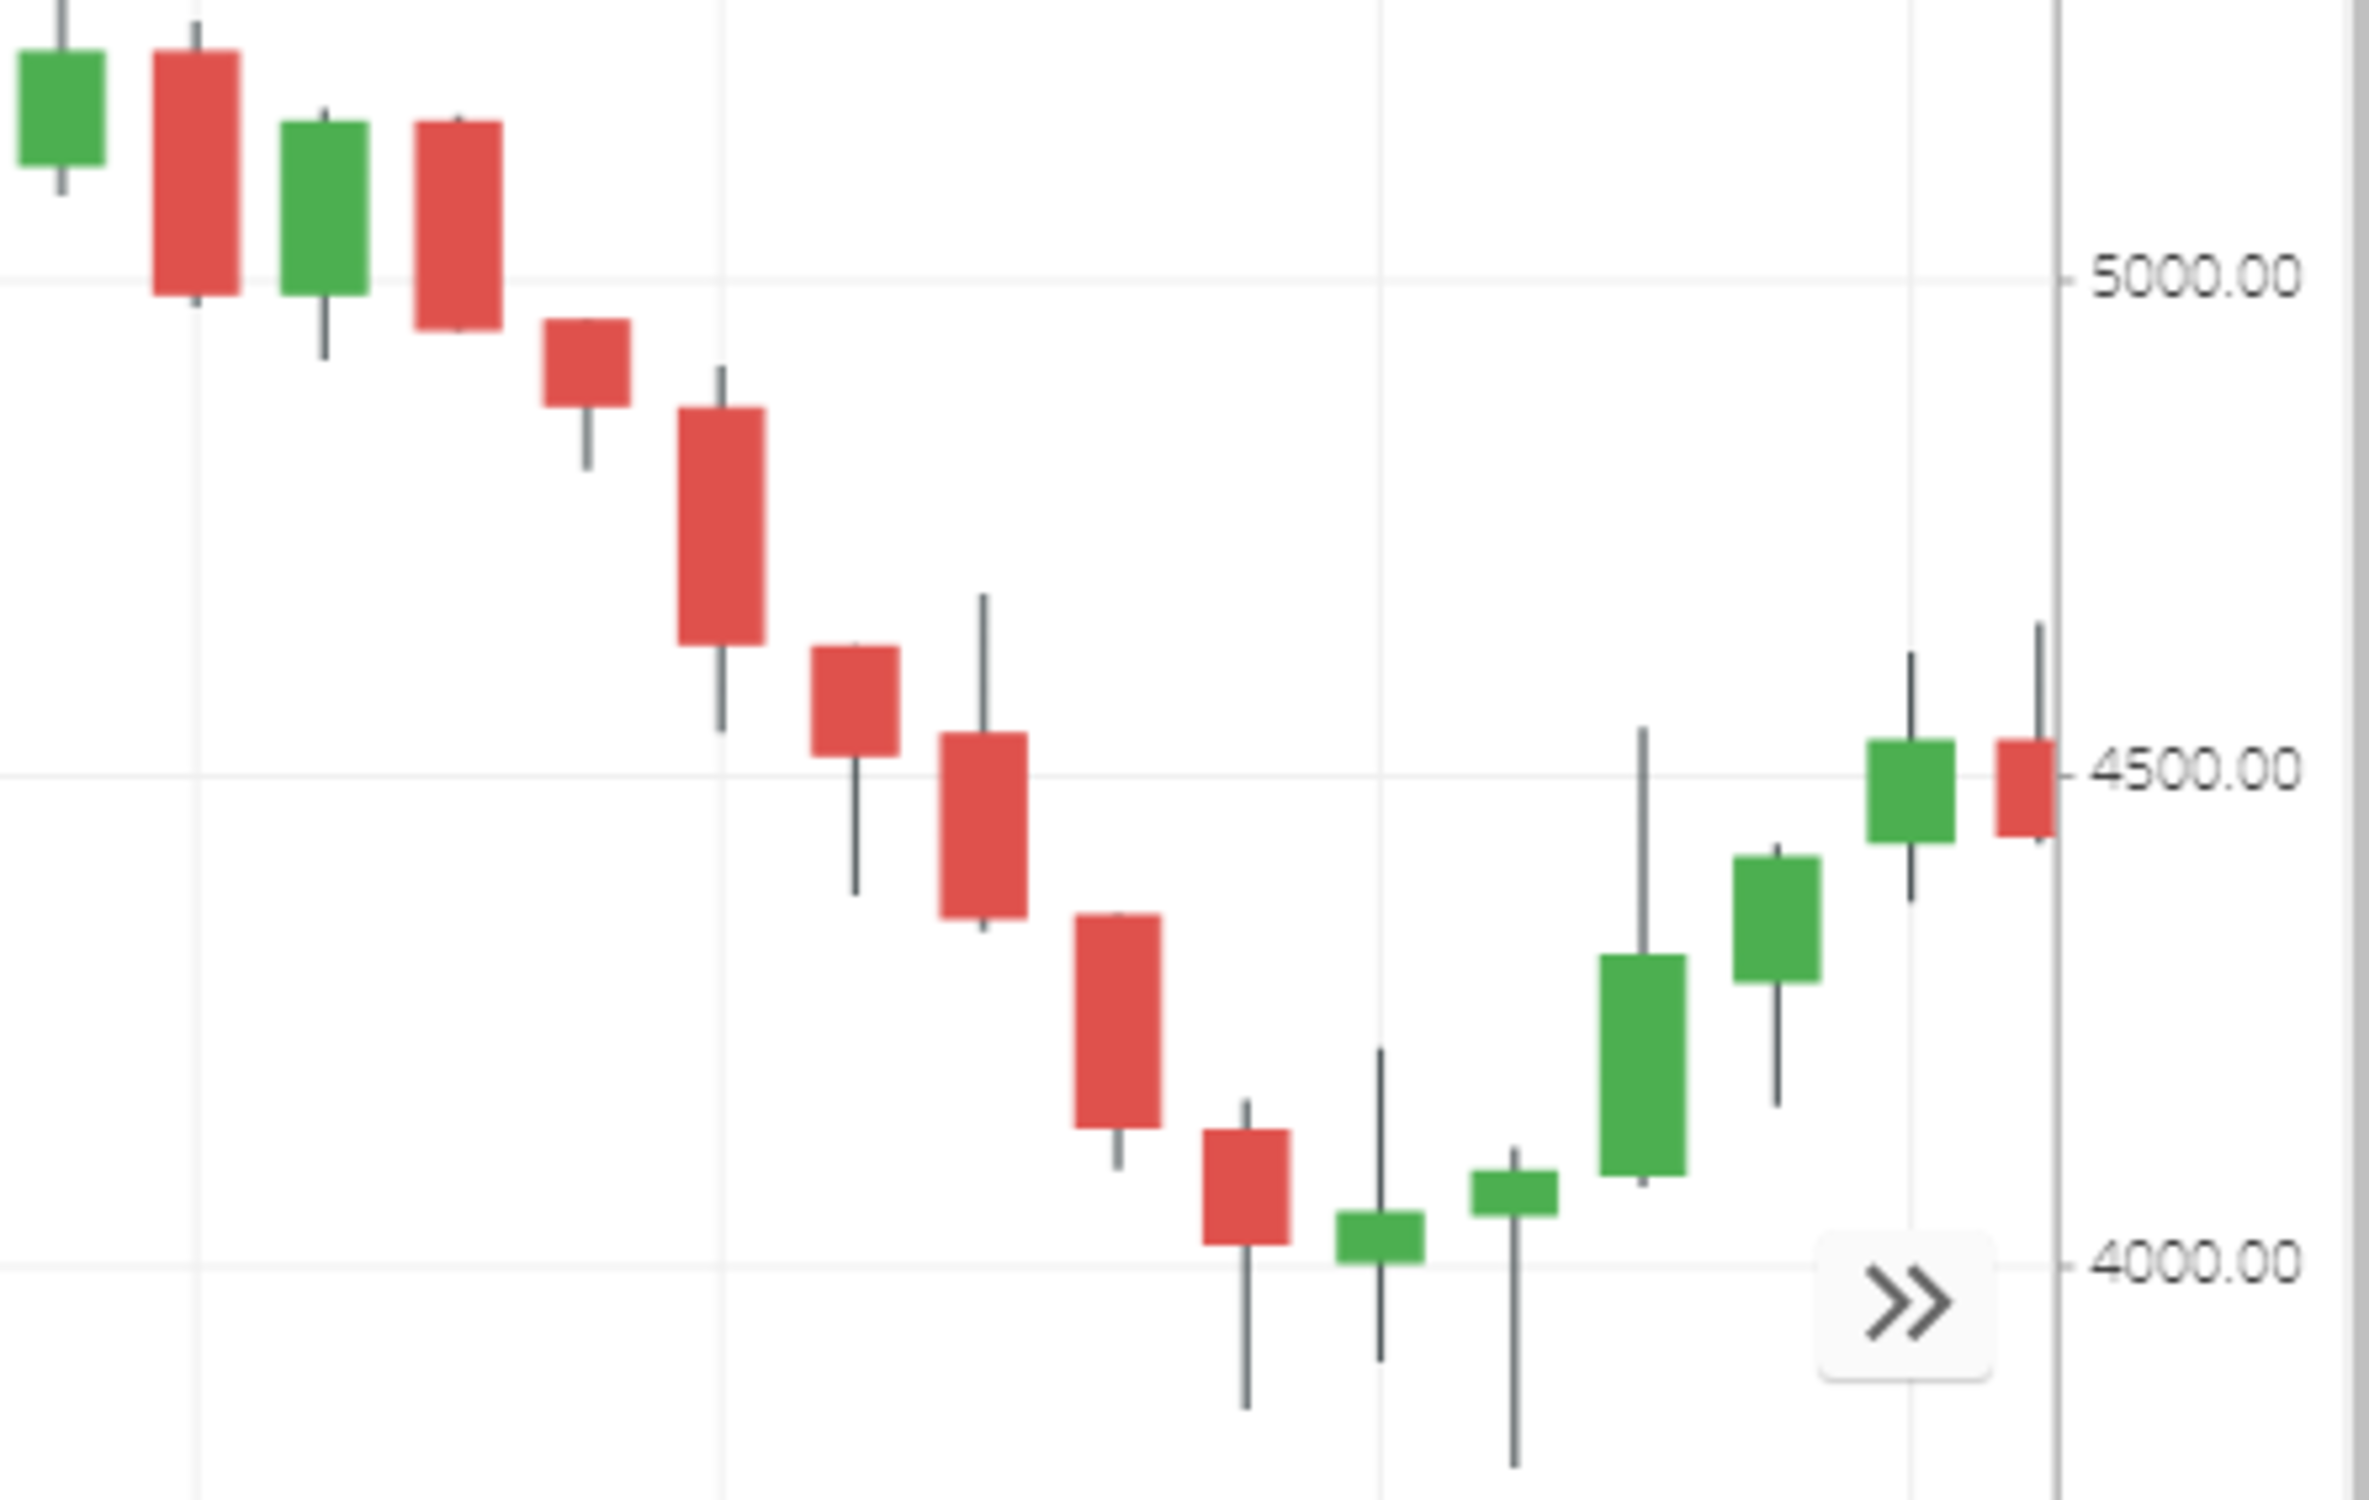
This phase also happened for a period of 15 weeks. 10 Weaks of fall and 5 Weaks of rising.

In the first 10 weeks, there is a fall of nearly 24% from 5200 to 4000

and the bounce is from 4000 to 4600 a rise of nearly 15 %.
The Stock Market Crash

3rd Phase Subprime Crisis

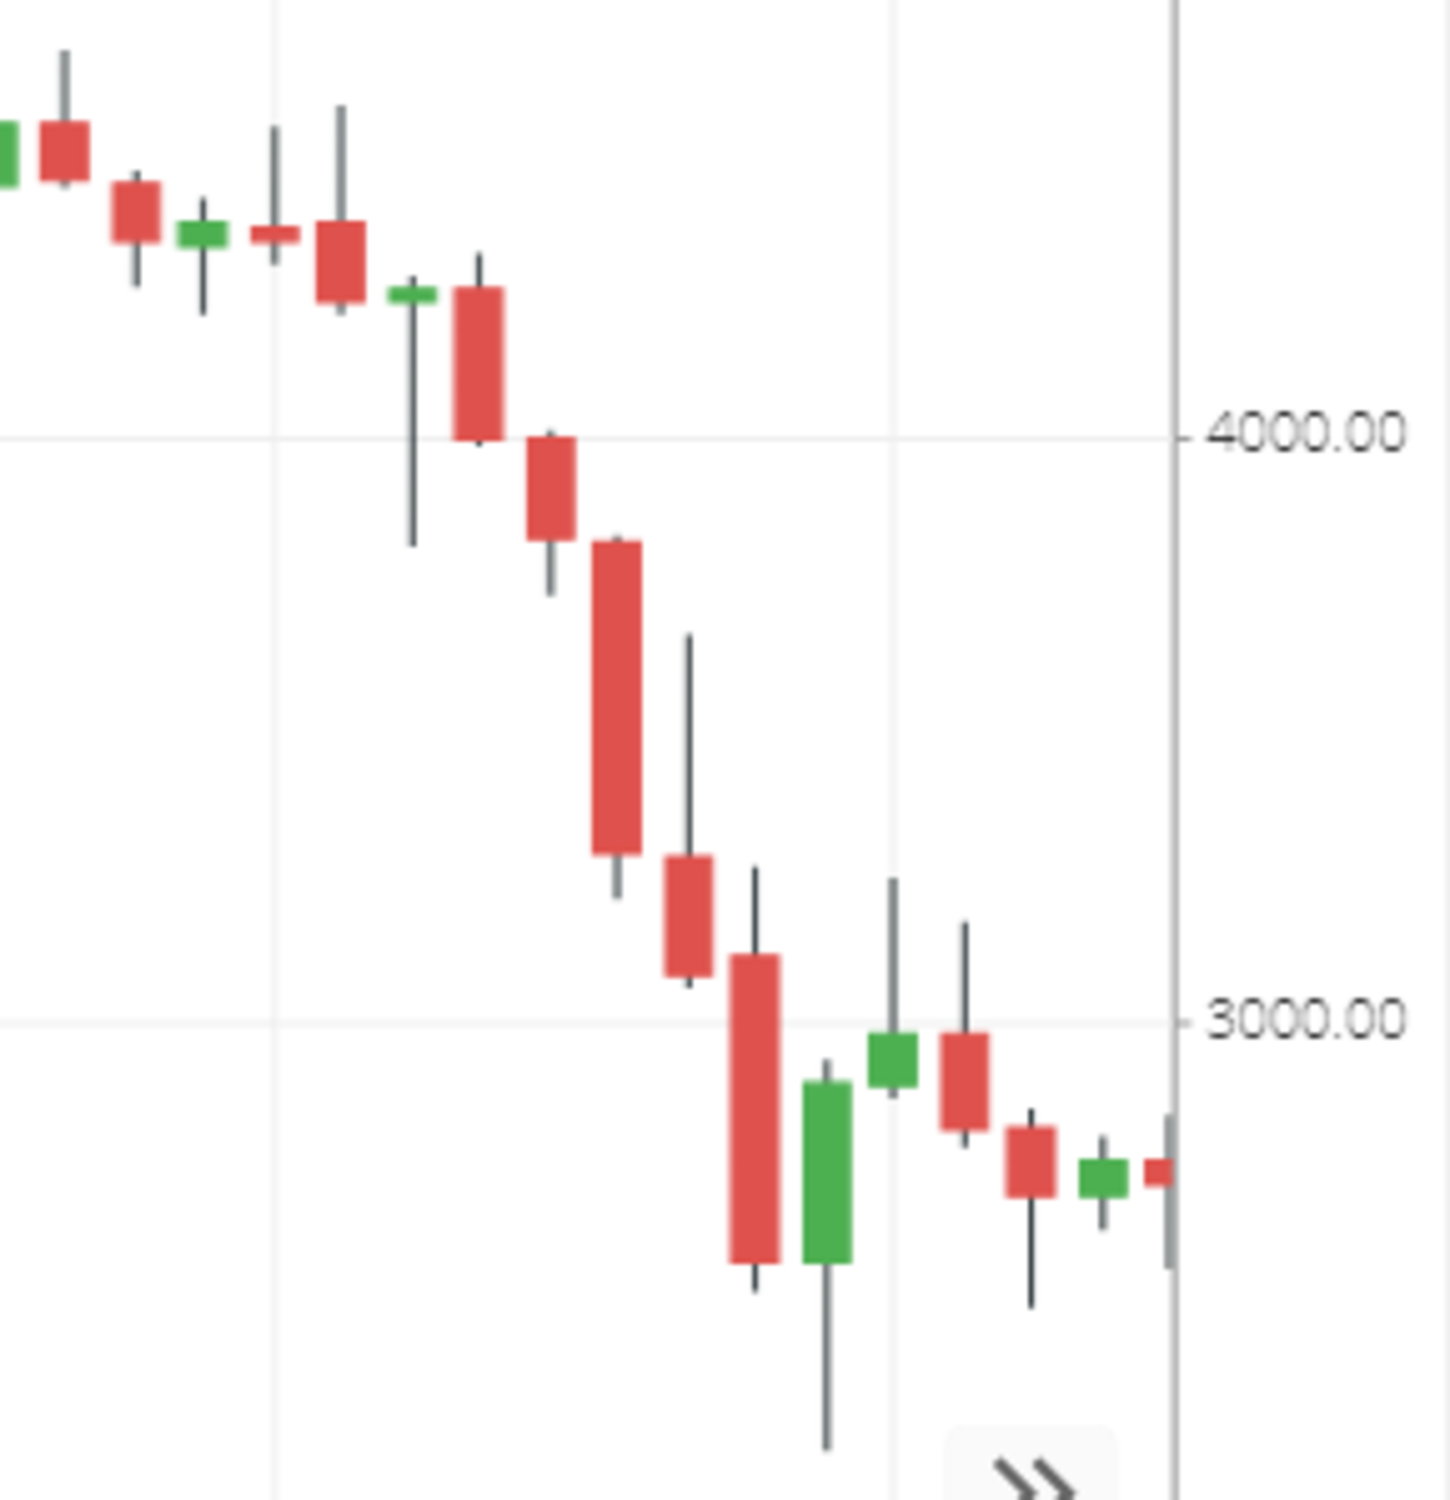
The 3rd Phase also happened for a period of 15 weeks. First 10 weeks of fall and next five weeks of a flat market.

In the first 10 weeks, there is a fall of nearly 44% from 4500 to 2500.

and the next two weak there is a bounce of 25% from 2500 to 3150.
Subprime Crisis
Subprime Crisis

Initial Crash of 2008 Crisis

In this post, we will discuss the Initial crash of the 2008 Crisis.

  • Chart taken is Day Chart
  • Nifty 50 Index

Market Fall

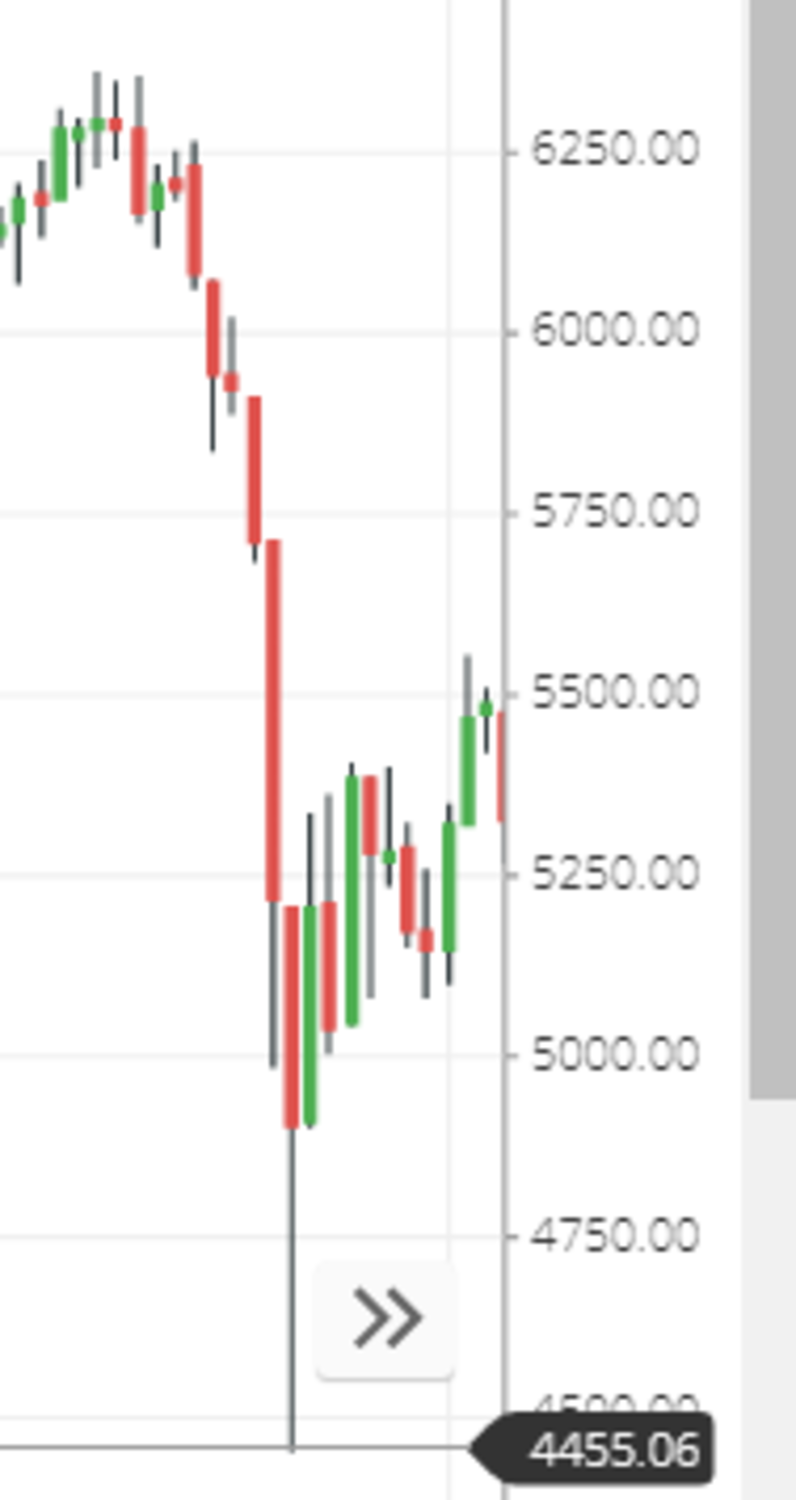
During the Start of 2008 Crash, the nifty index was trading at near 6300 levels. In the two weeks ( 10 Days ) the market Fall from 6300 levels to 4455. A fall of 29.2% in the first 2 weeks.
initial-crash
initial-crash

Market Bounce

In the next two days, it went up from 4455 levels to 5250 a bounce of 18% in two days

In the next two weak it went up from 4455 levels to 5500 a bounce of 24% and then the fall begins.

So this is the end of the Article.

Bookmark this Page and do invest taking this Idea. There is a high Probability to happen in the coming months.

Share as much as possible to the Investor Community.

Tags: Nifty 50
ShareTweetShareSendSendShare
Raveendran R

Raveendran R

Editor @ Indiancompaies.in

Related Posts

Inflation-Rate-in-India
Indian Economy

Inflation Rate in India [History 1950-2022]

July 16, 2021

Here we discuss about Historical Inflation Rate In India, Average Inflation Rate from 1985-2021,...

Indian Economy

India GDP Per Capita Income | State Highest 2022

April 16, 2022

Here we can Discuss Per capita income in India before that take a look...

Load More

Leave a Reply Cancel reply

Your email address will not be published. Required fields are marked *

  • Disclaimer
  • Privacy
  • About Me
  • Contact
© Indiancompanies.in.

Welcome Back!

Login to your account below

Forgotten Password?

Retrieve your password

Please enter your username or email address to reset your password.

Log In
No Result
View All Result
  • About Companies and Brands in India, Top 10 Companies, List of companies, Business Groups, Profiles
  • About Us
  • Checkout
  • Contact Us
  • Earnings Disclaimer
  • Login/Register
  • My account
  • Privacy Policy
  • Search Company and Brands in India
  • Submit Your Company Profile

© Indiancompanies.in.