In this post, we discuss the Historical Price earning ratio ( P E Ratio ) of Nifty 50 and also we discuss the Historical Price Book ratio ( P B Ratio). First, let us see what is PE Ratio and PB Ratio
Price To Earnings Ratio ( P E Ratio )
The formula for price to earnings ratio is
- Share Price divided by Earnings per share ( Or)
- Market capital of a company Divided by Net Profit
Price to Book Ratio ( P B Ratio )
The Formula for Price to Earnings ratio is
- Share Price Divided by Book value of a share
- Market Capital of a company divided by Net worth ( Equity )
Nifty 50 Index
NIFTY 50 track the performance of the top 50 large-cap companies selected based on Free Float Market capitalization. NIFTY 50 total return index delivered returns of 15.98% per annum during the previous 10 year period (as on March 29, 2019).
Interestingly, these returns also converge with India’s GDP growth which has shown a 10-year CAGR of ~13% in nominal terms (Gross Domestic Product at Current Prices) over the same period (FY09 – 19E)
Historical Price to Earnings ratio ( PE Ratio ) and Price to Book Ratio ( PB Ratio ) of Nifty 50 Index
The below chart shows PE and PB ratio for Each year from the year 2000 to 2018. Blueline indicates PE ratio and the redline indicates PB ratio.
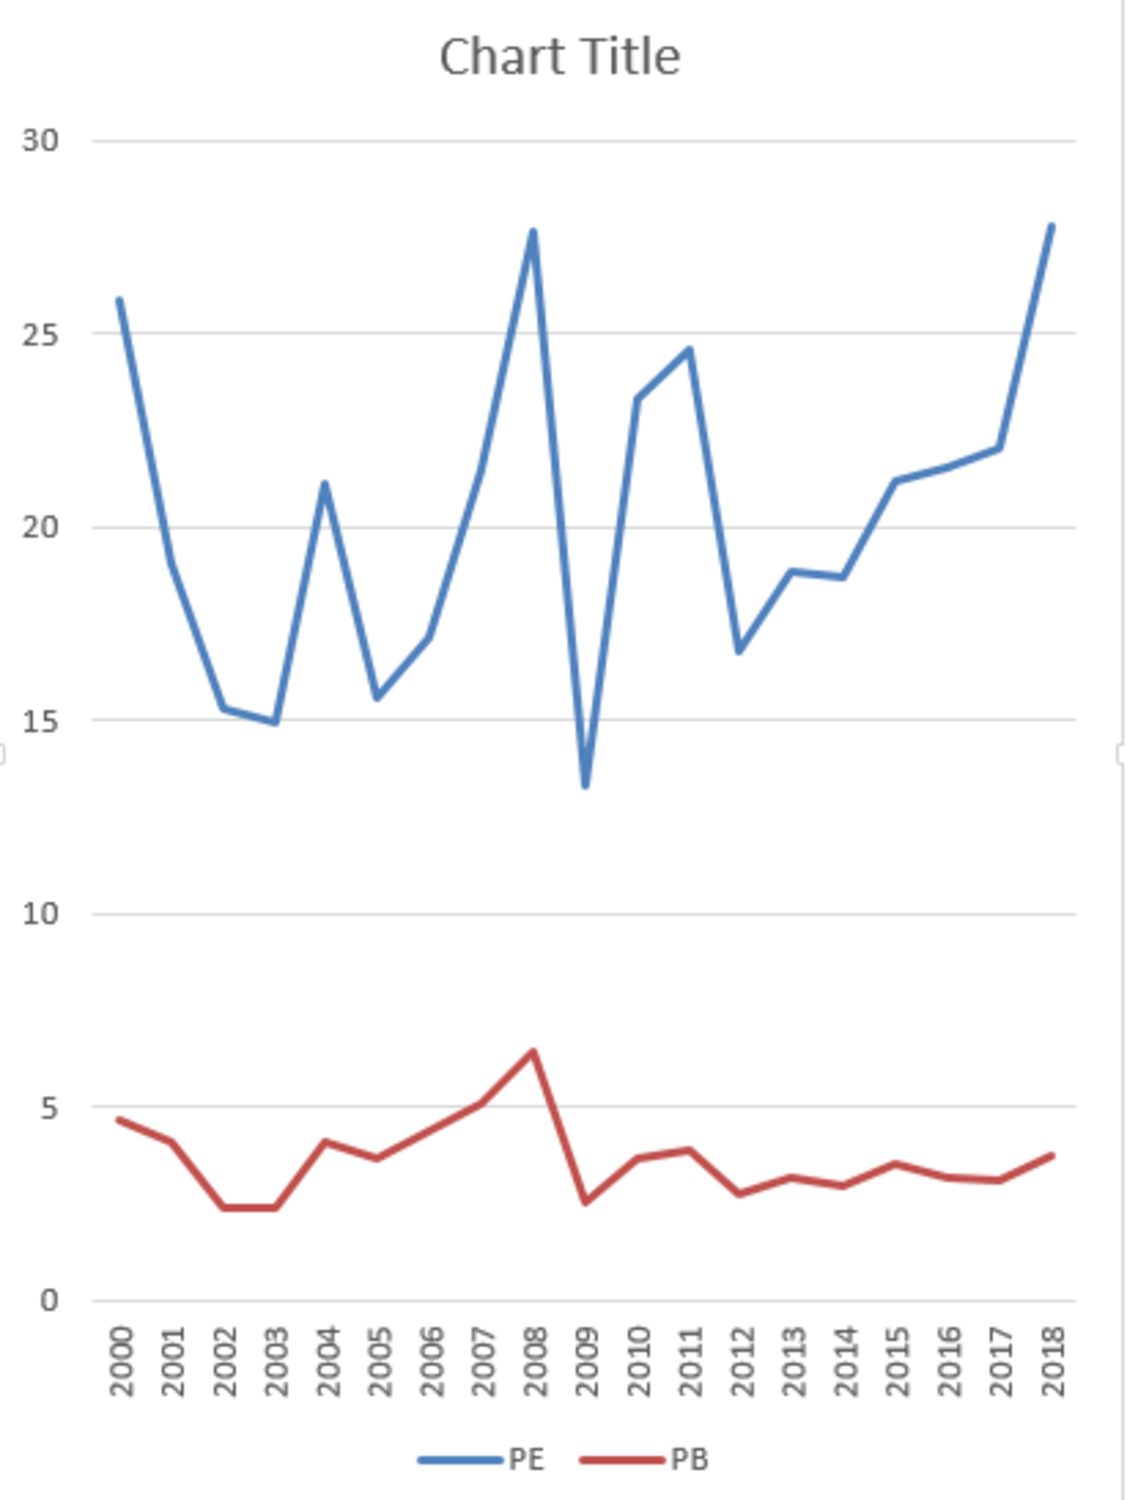
The average PE Ratio for Nifty 50 Index Stands at 20.33 and the maximum and minimum PE ratio is 29 and 13.33
The average PB Ratio for Nifty 50 Index Stands at 3.67 and the maximum and minimum PB ratio is 6.40 and 2.39
- Average P E Ratio = 20.33
- Maximum PE ratio = 29
- Minimum PE Ratio = 13.33
- Average P B Ratio = 3.67
- Maximum PB ratio = 6.40
- Minimum PB Ratio = 2.39
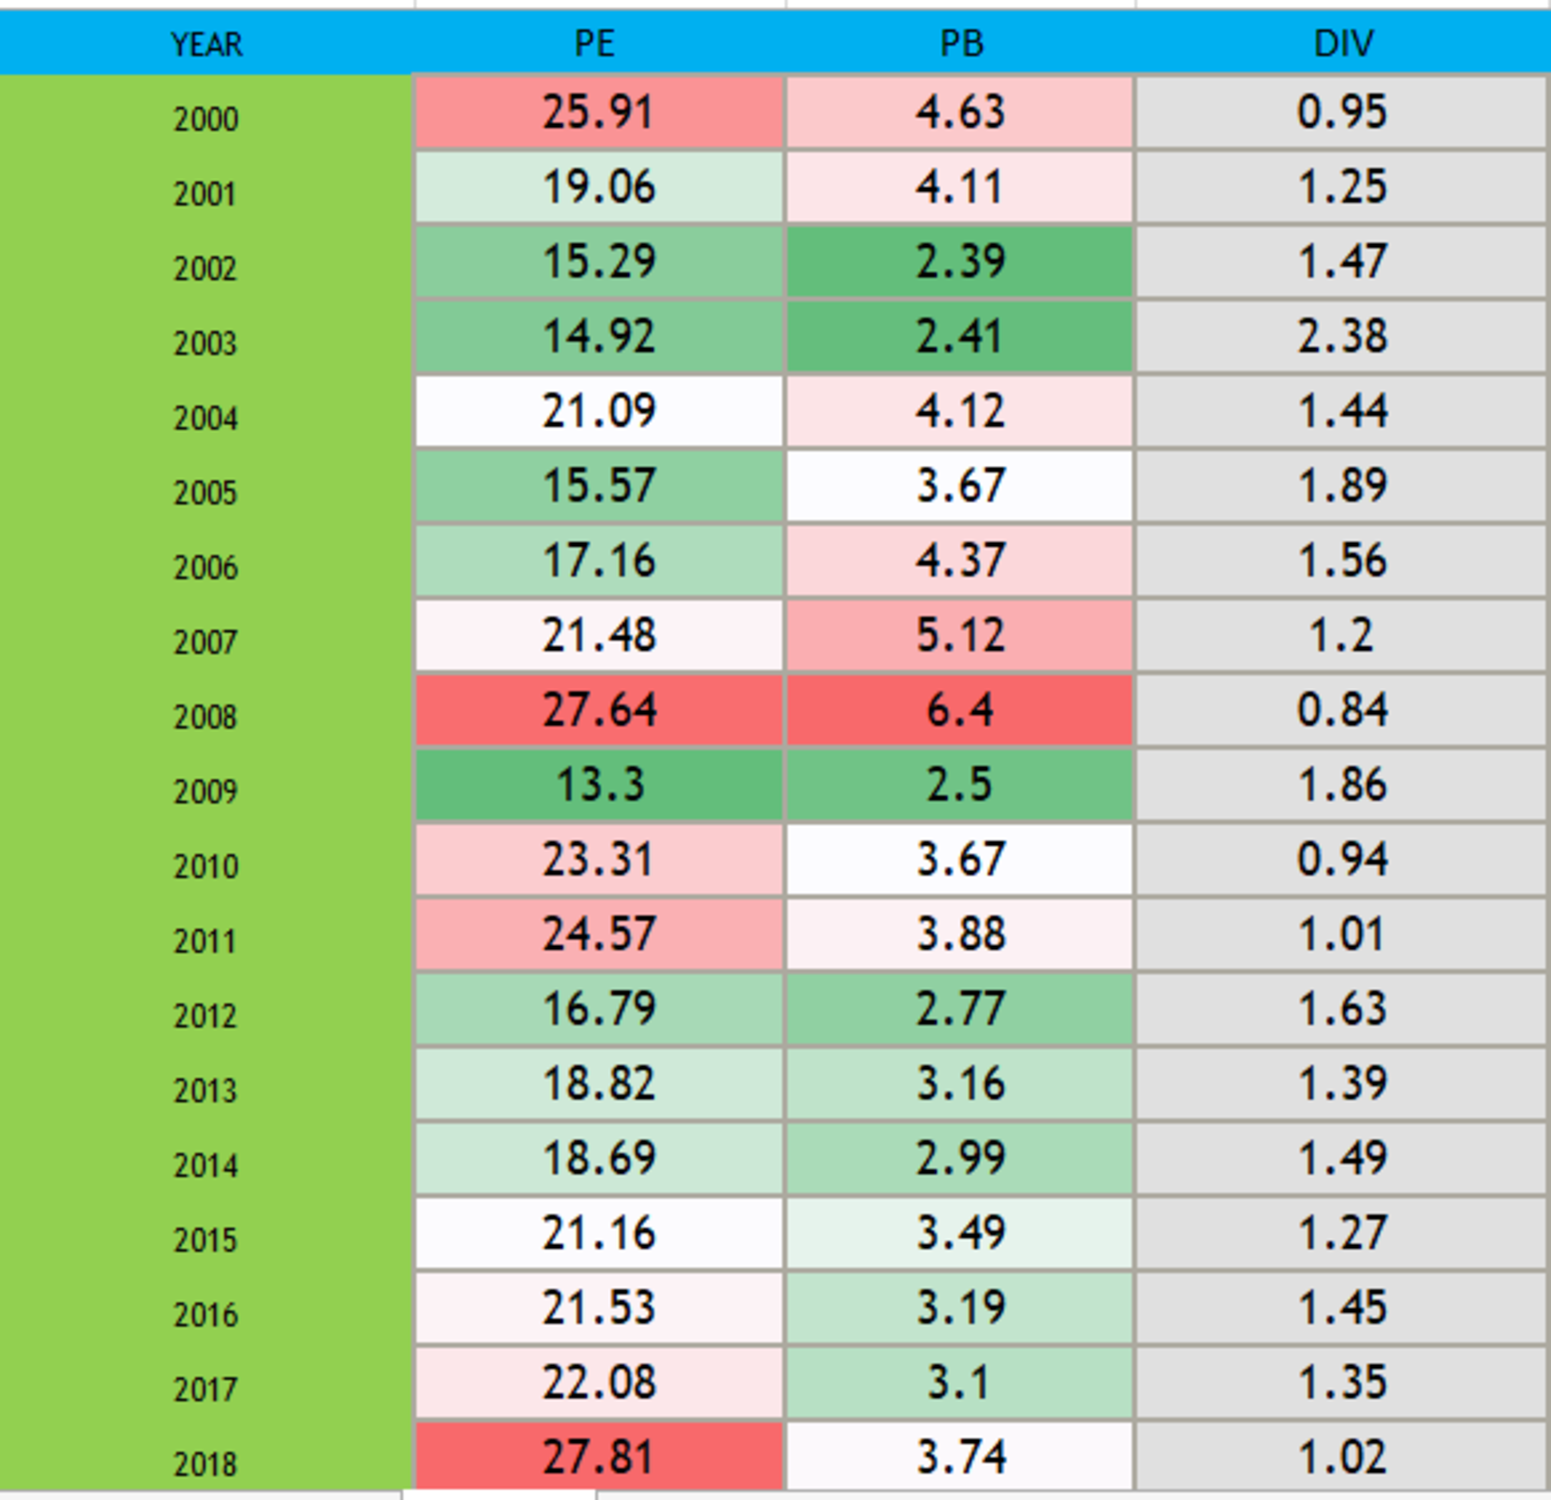
- Last Column is a dividend in Percentage.
| YEAR | PE | PB | DIV |
| 2000 | 25.91 | 4.63 | 0.95 |
| 2001 | 19.06 | 4.11 | 1.25 |
| 2002 | 15.29 | 2.39 | 1.47 |
| 2003 | 14.92 | 2.41 | 2.38 |
| 2004 | 21.09 | 4.12 | 1.44 |
| 2005 | 15.57 | 3.67 | 1.89 |
| 2006 | 17.16 | 4.37 | 1.56 |
| 2007 | 21.48 | 5.12 | 1.2 |
| 2008 | 27.64 | 6.4 | 0.84 |
| 2009 | 13.3 | 2.5 | 1.86 |
| 2010 | 23.31 | 3.67 | 0.94 |
| 2011 | 24.57 | 3.88 | 1.01 |
| 2012 | 16.79 | 2.77 | 1.63 |
| 2013 | 18.82 | 3.16 | 1.39 |
| 2014 | 18.69 | 2.99 | 1.49 |
| 2015 | 21.16 | 3.49 | 1.27 |
| 2016 | 21.53 | 3.19 | 1.45 |
| 2017 | 22.08 | 3.1 | 1.35 |
| 2018 | 27.81 | 3.74 | 1.02 |
| 2019 | 29 | 3.8 | 1.01 |
| TODAY ( Updated weakly ) | 24 | 4.4 | 1.13 |
| AVERAGE RATIO | 20.33 | 3.67 | 1.39 |
| MAXIMUM RATIO | 29 | 6.4 | 2.38 |
| MINIMUM RATIO | 13.3 | 2.39 | 0.84 |
Risk of PE and PB is given Red and Green
- Red = High Risk
- Green = Less Risk






Please sir infametion me
Hello sir
Plz sir information me.