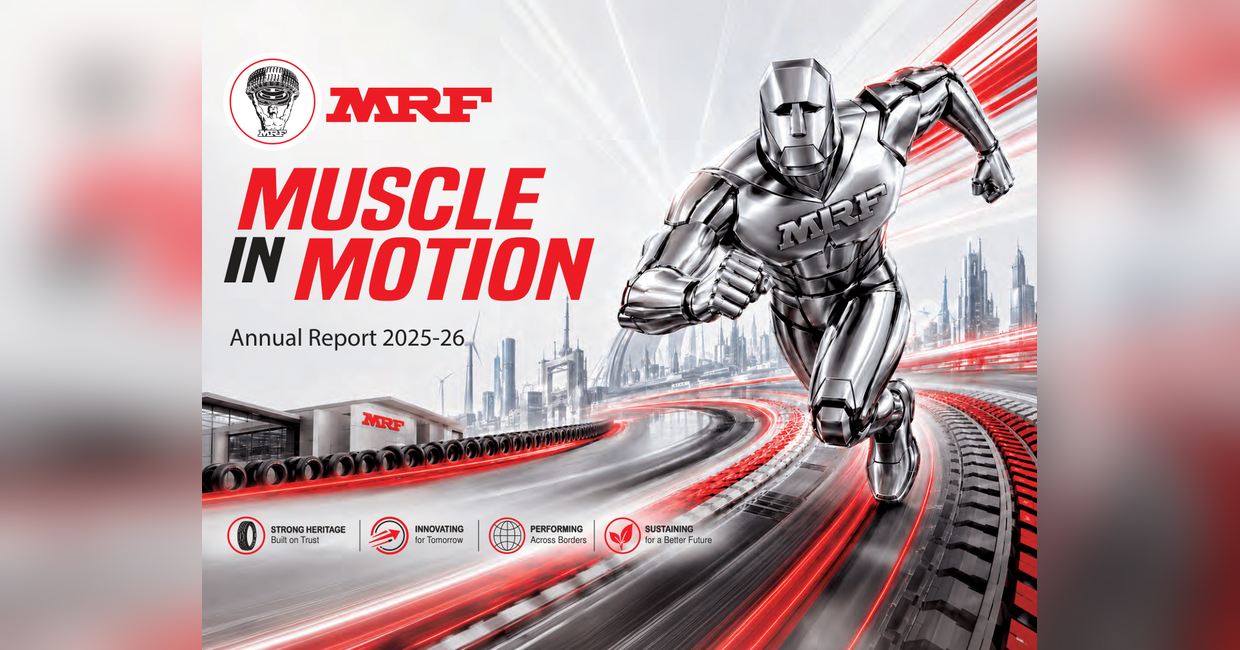

Source: MRF Limited Annual Report 2025-26
Quick Facts / Company Snapshot
| Metric / Attribute | Details (FY 2025-26 / As of 31st March 2026) |
|---|---|
| Company Name | MRF Limited |
| Corporate Identity Number (CIN) | L25111TN1960PLC004306 |
| Incorporation Date | 5th November 1960 |
| Registered Office | No. 114, Greams Road, Chennai – 600 006, Tamil Nadu, India |
| Stock Exchange Listings | National Stock Exchange of India Ltd. (NSE), Bombay Stock Exchange Ltd. (BSE) |
| International Securities Identification Number (ISIN) | INE883A01011 |
| Chairman & Managing Director | K. M. Mammen |
| Consolidated Revenue from Operations | ₹31,149.01 Crores |
| Standalone Revenue from Operations | ₹30,652.08 Crores |
| Consolidated Profit Before Tax (PBT) | ₹3,222.14 Crores |
| Consolidated Profit After Tax (PAT) | ₹2,426.10 Crores |
| Consolidated Total Comprehensive Income | ₹2,464.46 Crores |
| Consolidated Net Worth | ₹20,974.75 Crores |
| Standalone Earnings Per Share (Basic & Diluted) | ₹5,553.70 |
| Consolidated Earnings Per Share (Basic & Diluted) | ₹5,720.39 |
| Total Dividend Per Share | ₹235/- per share of ₹10 each (2350%) |
| Total Permanent Employees | 16,283 |
| Manufacturing Facilities | 10 state-of-the-art factories across India |
| Global Industry Standing | India’s largest tyre manufacturer; ranked amongst top 15 global manufacturers |
| Renewable Energy Share in Operations | 30% (increased from 24% in FY 2024–25) |
Source: MRF Limited Annual Report 2025-26 Disclosures
Company Overview
MRF Limited is India’s largest tyre manufacturer and ranks amongst the top 15 global manufacturers. Incorporated on 5th November 1960, the company serves as the ultimate parent entity of the MRF Group. Operating an expansive production footprint consisting of 10 state-of-the-art factories across India, MRF manufactures a versatile portfolio of rubber products ranging from two-wheeler tyres to specialised aviation tyres for fighter aircraft.
In fiscal year 2025-26, the company achieved an operational milestone by crossing ₹30,000 Crores in consolidated revenue from operations, ending the financial year at ₹31,149.01 Crores. Supported by strong replacement market demand, original equipment manufacturer (OEM) partnerships, and government fiscal policy measures like GST revisions, the company maintained its domestic tyre leadership position—a distinction held for close to four decades.
Business Segments
Under Indian Accounting Standard (Ind AS) 108, the company operates primarily in a single reportable primary business segment: the manufacture and trading of Rubber Products, which encompasses tyres, tubes, flaps, and tread rubber. Outside of this primary rubber segment, subsidiary MRF Corp Ltd manufactures speciality surface coatings, and MRF Foundation functions as a public charitable trust. Because the non-rubber activities fall below quantitative materiality thresholds, separate segment disaggregation is not mandated under Ind AS 108.
Across the group, consolidated revenue streams break down into specific product categories as follows:
Related Posts



| Product / Revenue Category | Consolidated Revenue (₹ Crores) | % Contribution to Product Revenue |
|---|---|---|
| Automobile Tyres | 28,260.69 | 91.48% |
| Automobile Tubes | 1,697.15 | 5.49% |
| Speciality Coating (MRF Corp Ltd) | 481.64 | 1.56% |
| Others | 454.66 | 1.47% |
| Total Revenue from Sale of Goods | 30,894.14 | 100.00% |
Source: MRF Limited Annual Report 2025-26 – Note 25(e) to Consolidated Financial Statements (Percentages calculated by FirmsWorld)
Additional consolidated operational receipts include ₹37.53 Crores from sale of services, ₹209.90 Crores from scrap sales, and ₹7.44 Crores in state government subsidies, culminating in total consolidated revenue from operations of ₹31,149.01 Crores.
History and Evolution
Since its incorporation in November 1960, MRF Limited has grown from an Indian manufacturing firm into a diversified rubber enterprise. Through persistent investments in in-house research and development, compound chemistry, and advanced tyre dynamics, the enterprise has developed tyre products spanning passenger cars, heavy commercial haulage, agricultural equipment, earthmovers, high-speed superbikes, and military aviation applications.
Over the decades, MRF established captive technical capabilities, eliminating reliance on imported technical collaborations for several decades. During FY 2025-26, the company marked its sixty-fifth annual operating cycle, cementing a footprint of 10 modern production plants and a distribution network that serves both the domestic replacement market and global export destinations.
Products and Services
The company provides a comprehensive product and service offering serving multiple consumer and industrial mobility categories:
- Commercial Vehicle (CV) Tyres: Includes heavy, medium, and light commercial vehicle radials and bias tyres. Key products include the newly launched MRF Musclerok Steer (steer axle tyre for mining and off-road applications) and the MRF Super Lug 001 (11.00-20 tipper application tyre).
- Passenger Vehicle (PV) & SUV Tyres: Features radials engineered for internal combustion engine (ICE) and electric vehicle (EV) platforms. Milestones include becoming the first in India to supply 20-inch rim size tyres in the OE segment for domestic PVs, alongside introducing acoustic foam tyres for EVs. The MRF Wanderer range serves as a leading fitment for domestic SUV manufacturers.
- Two-Wheeler & Superbike Tyres: Spans mass commuter tyres, high-speed sport radials, and specialized superbike lines. Offerings include the MRF Steel Brace SP-01 (‘W’ rated steel radial approved for the Suzuki Hayabusa) and the MRF Revz Steel SR-01 (‘H’ rated radial for 150–250 cc sports motorcycles).
- Farm & Agro-Industrial Tyres: Includes the Farm Muscle 65 radial tractor series and the MRF Musclegrip (460/70 R24 IND) multipurpose agro-industrial tyre for soft-terrain and telescopic equipment.
- Off-The-Road (OTR) & Small Commercial Vehicle (SCV) Tyres: Features the MRF Musclerok Xtra (14.00-25) for backhoe loaders, as well as the E-Savari range (4.00-12 E-Savari-M, 3.75-12 E-Savari LRR TL, and 100/90-12 E-Savari LRR TL) engineered for load-carrying and passenger electric rickshaws.
- MRF Pretreads: Retreading systems featuring precured tread designs such as the PCTR Lug 001 bias block pattern.
- Speciality Coatings (MRF Corp Ltd): Architectural, decorative, and industrial polyurethane coatings, including WoodCoat Italia, Durothane PU, and Damp Defence.
- Automotive Care Services: Specialized automated wheel care, alignment, and balancing provided through comprehensive retail centres, such as the modernized flagship MRF Tyredrome on Cathedral Road, Chennai.
Brand Portfolio
The company markets its products under corporate and category-specific trade names:
- MRF: The primary corporate master brand representing passenger, commercial, motorsport, and aviation tyres.
- MRF Wanderer: Specialized premium SUV tyre range engineered for highway and all-terrain performance.
- MRF Steel Brace & MRF Revz: Performance motorcycle radials designed for high-displacement superbikes and entry-level sportbikes.
- MRF E-Savari: Low-rolling-resistance and heavy-duty tubeless tyre lines designed for urban electric three-wheelers.
- MRF Musclerok & Super Lug: Rugged commercial, mining, and earthmoving tyre sub-brands.
- MRF Pretreads: Retread rubber solutions and cold-cured tread liners.
- Vapocure Paints / Durothane: Speciality protective and decorative coating systems marketed through MRF Corp Limited.
- MRF Tyredrome: Branded automotive care and optical tyre diagnostic service facilities.
Geographical Presence
MRF maintains operations across India and exports to international markets in the Middle East, Africa, South East Asia, Europe, and the Americas.
Revenue distribution across geographical regions for the financial year ended 31st March 2026 is outlined below:
| Geography | Standalone Revenue (₹ Crores) | Consolidated Revenue (₹ Crores) | Consolidated Share (%) |
|---|---|---|---|
| India (Domestic Market) | 28,074.45 | 28,555.95 | 92.43% |
| Outside India (Exports & Overseas Operations) | 2,324.17 | 2,338.19 | 7.57% |
| Total Revenue from Customers | 30,398.62 | 30,894.14 | 100.00% |
Source: Note 27(d) Standalone & Note 25(e) Consolidated Financial Statements (Percentages calculated by FirmsWorld)
Non-current assets by geographic location demonstrate that the manufacturing and physical asset foundation is predominantly domestic. Out of consolidated non-current assets, ₹17,121.95 Crores are located in India, while ₹15.06 Crores reside outside India.
Profit and Loss Performance
Both standalone and consolidated statements show double-digit operational expansion in FY 2025-26 compared to FY 2024-25. Total standalone income reached ₹31,140.25 Crores (an increase of 10.95%), while consolidated total income advanced to ₹31,653.64 Crores.
| Statement of Profit and Loss (₹ Crores) | Standalone 2025-26 | Standalone 2024-25 | Consolidated 2025-26 | Consolidated 2024-25 |
|---|---|---|---|---|
| Revenue from Operations | 30,652.08 | 27,665.22 | 31,149.01 | 28,153.00 |
| Other Income | 488.17 | 402.86 | 504.63 | 416.65 |
| Total Income | 31,140.25 | 28,068.08 | 31,653.64 | 28,569.65 |
| Cost of Materials Consumed | 18,740.53 | 18,348.97 | 18,883.18 | 18,487.98 |
| Purchases of Stock-in-Trade | 34.29 | 28.10 | 34.60 | 28.45 |
| Changes in Inventories (FG, WIP, Stock-in-Trade) | 602.46 | (601.10) | 605.16 | (590.31) |
| Employee Benefits Expense | 1,991.93 | 1,831.53 | 2,045.93 | 1,885.14 |
| Finance Costs | 297.06 | 291.43 | 366.20 | 360.03 |
| Depreciation and Amortisation Expense | 1,747.33 | 1,647.40 | 1,753.63 | 1,653.55 |
| Other Expenses | 4,531.19 | 4,101.85 | 4,679.56 | 4,261.81 |
| Total Expenses | 27,944.79 | 25,648.18 | 28,368.26 | 26,086.65 |
| Profit Before Exceptional Items and Tax | 3,195.46 | 2,419.90 | 3,285.38 | 2,483.00 |
| Exceptional Items (Impact due to Wage Code) | (61.99) | – | (63.24) | – |
| Profit Before Tax (PBT) | 3,133.47 | 2,419.90 | 3,222.14 | 2,483.00 |
| Current Tax | 730.11 | 597.86 | 747.47 | 608.45 |
| Deferred Tax | 47.96 | (0.51) | 48.57 | 1.26 |
| Total Tax Expense | 778.07 | 597.35 | 796.04 | 609.71 |
| Profit for the Year (PAT) | 2,355.40 | 1,822.55 | 2,426.10 | 1,873.29 |
| Non-Controlling Interest | – | – | (0.01) | (0.01) |
| Other Comprehensive Income / (Loss) (Net of Tax) | 20.35 | (2.51) | 38.37 | 1.01 |
| Total Comprehensive Income for the Year | 2,375.75 | 1,820.04 | 2,464.46 | 1,874.29 |
Source: MRF Limited Annual Report 2025-26 Financial Statements
Key Financial Ratios
| Financial Ratio | Numerator / Denominator | FY 2025-26 | FY 2024-25 | % Change |
|---|---|---|---|---|
| Current Ratio | Current Assets / Current Liabilities | 1.62 | 1.48 | 9% |
| Debt Equity Ratio | Long Term Debt / Shareholder’s Equity | 0.02 | 0.04 | -53% |
| Debt Service Coverage Ratio | EBITDA / (Interest Expense + Principal Repayments) | 9.03 | 13.63 | -34% |
| Return on Equity (%) | PAT (after exceptional item) / Average Shareholder Equity | 12.20% | 10.53% | 16% |
| Inventory Turnover Ratio | Cost of Sales / Average Inventory | 5.25 | 5.27 | – |
| Trade Receivables Turnover | Net Credit Sales / Average Trade Receivables | 9.04 | 9.00 | – |
| Trade Payables Turnover | Net Credit Purchases / Average Trade Payables | 3.63 | 4.42 | -18% |
| Net Capital Turnover Ratio | Net Sales / Working Capital | 5.58 | 6.57 | -15% |
| Net Profit Margin (%) | PAT (after exceptional item) / Total Income | 7.56% | 6.49% | 16% |
| Return on Capital Employed (%) | EBIT (excl. other income & exceptional) / Capital Employed | 13.14% | 11.39% | 15% |
| Return on Investment (%) | Income generated from funds / Time-weighted average investments | 6.46% | 8.34% | -23% |
Source: Note 27(p)(i) to Standalone Financial Statements
Balance Sheet Structure
MRF closed FY 2025-26 with a debt-to-equity ratio of 0.02 and a consolidated net worth of ₹20,974.75 Crores. Total assets expanded to ₹31,953.51 Crores on a consolidated basis.
| Balance Sheet Items (₹ Crores) | Standalone 31.03.2026 | Standalone 31.03.2025 | Consolidated 31.03.2026 | Consolidated 31.03.2025 |
|---|---|---|---|---|
| Non-Current Assets: | ||||
| Property, Plant and Equipment | 12,042.37 | 12,257.95 | 12,136.15 | 12,350.88 |
| Capital Work-in-Progress (CWIP) | 1,032.57 | 1,166.47 | 1,033.80 | 1,168.63 |
| Right of Use Assets | 808.25 | 850.22 | 808.37 | 850.34 |
| Other Intangible Assets | 20.56 | 20.56 | 21.90 | 21.33 |
| Non-Current Financial Investments | 361.59 | 1,155.67 | 340.96 | 1,134.82 |
| Non-Current Loans | 0.41 | 7.61 | 0.49 | 7.67 |
| Other Non-Current Financial Assets | 1,925.38 | 28.71 | 2,046.10 | 41.19 |
| Non-Current Tax Asset (Net) | 263.15 | 329.29 | 275.63 | 340.58 |
| Other Non-Current Assets | 472.71 | 264.82 | 473.61 | 266.82 |
| Current Assets: | ||||
| Inventories | 5,337.66 | 5,539.34 | 5,416.82 | 5,624.78 |
| Current Financial Investments | 2,985.74 | 3,403.33 | 3,056.85 | 3,413.42 |
| Trade Receivables | 3,477.27 | 3,302.13 | 3,541.58 | 3,370.25 |
| Cash and Cash Equivalents | 260.84 | 243.61 | 304.59 | 373.85 |
| Other Bank Balances | 1,763.97 | 5.85 | 1,878.13 | 112.91 |
| Current Loans | 3.49 | 4.99 | 3.53 | 5.02 |
| Other Current Financial Assets | 181.06 | 191.20 | 193.01 | 192.65 |
| Other Current Assets | 359.44 | 324.35 | 421.99 | 413.80 |
| Total Assets | 31,296.46 | 29,096.10 | 31,953.51 | 29,688.94 |
| Equity: | ||||
| Share Capital | 4.24 | 4.24 | 4.24 | 4.24 |
| Other Equity | 20,447.71 | 18,171.63 | 20,970.32 | 18,605.52 |
| Non-Controlling Interest | – | – | 0.19 | 0.18 |
| Total Equity | 20,451.95 | 18,175.87 | 20,974.75 | 18,609.94 |
| Non-Current Liabilities: | ||||
| Non-Current Borrowings | 176.02 | 374.43 | 176.02 | 374.43 |
| Lease Liabilities (Non-Current) | 719.26 | 755.31 | 719.26 | 755.31 |
| Non-Current Provisions | 344.93 | 284.88 | 345.44 | 285.29 |
| Deferred Tax Liabilities (Net) | 511.31 | 456.50 | 517.79 | 462.39 |
| Other Non-Current Liabilities | 213.97 | 242.60 | 213.98 | 241.36 |
| Current Liabilities: | ||||
| Current Borrowings | 674.09 | 1,212.11 | 2,191.03 | 2,530.47 |
| Lease Liabilities (Current) | 120.21 | 110.84 | 120.35 | 110.95 |
| Trade Payables – MSME | 54.95 | 28.55 | 62.28 | 37.74 |
| Trade Payables – Non-MSME | 4,567.45 | 3,978.19 | 3,148.48 | 2,784.62 |
| Other Current Financial Liabilities | 408.10 | 388.32 | 412.41 | 391.31 |
| Other Current Liabilities | 2,575.55 | 2,746.50 | 2,583.85 | 2,754.46 |
| Current Provisions | 478.67 | 342.00 | 481.00 | 344.37 |
| Current Tax Liabilities (Net) | – | – | 6.87 | 6.30 |
| Total Liabilities | 10,844.51 | 10,920.23 | 10,978.76 | 11,079.00 |
| Total Equity and Liabilities | 31,296.46 | 29,096.10 | 31,953.51 | 29,688.94 |
Source: MRF Limited Balance Sheets (Standalone & Consolidated) as of 31st March 2026
Cash Flow Dynamics
In FY 2025-26, MRF generated standalone net cash from operating activities of ₹4,638.95 Crores, an increase from ₹2,638.69 Crores in FY 2024-25. Consolidated cash generated from operations stood at ₹5,272.25 Crores prior to direct taxes paid of ₹681.95 Crores, yielding consolidated net operating cash flow of ₹4,590.30 Crores.
| Summary Cash Flow Items (₹ Crores) | Standalone 2025-26 | Standalone 2024-25 | Consolidated 2025-26 | Consolidated 2024-25 |
|---|---|---|---|---|
| Cash Generated from Operations | 5,302.92 | 3,222.30 | 5,272.25 | 2,455.95 |
| Direct Taxes Paid | (663.97) | (583.61) | (681.95) | (591.19) |
| Net Cash from Operating Activities (A) | 4,638.95 | 2,638.69 | 4,590.30 | 1,864.76 |
| Purchase of Property, Plant & Equipment (Capex) | (1,427.91) | (1,298.74) | (1,434.25) | (1,309.45) |
| Proceeds from Sale of PPE | 8.23 | 13.30 | 8.23 | 13.63 |
| Net Placement / Proceeds of Investments & FDs | (2,074.78) | (915.79) | (2,247.96) | (892.76) |
| Interest & Dividend Received | 111.41 | 97.47 | 124.95 | 114.84 |
| Loans (Financial Assets) Net Inflows / Outflows | 8.17 | (3.56) | 8.13 | (3.54) |
| Net Cash Used in Investing Activities (B) | (3,368.88) | (2,107.32) | (3,536.15) | (2,077.28) |
| Repayment of Working Capital / Bank Borrowings | (385.55) | 57.00 | (186.57) | 919.51 |
| Repayment of Term Loans | (200.00) | (100.00) | (200.00) | (100.00) |
| Redemption of Non-Convertible Debentures | (150.00) | – | (150.00) | – |
| Payment of Lease Liabilities | (194.95) | (180.62) | (194.95) | (180.62) |
| Interest Paid | (220.10) | (215.58) | (289.63) | (272.62) |
| Dividends Paid | (99.67) | (84.82) | (99.66) | (84.82) |
| Other Financing Flows (Grants, Deferred Credits) | 0.48 | 0.55 | 0.48 | 0.55 |
| Net Cash from / (Used in) Financing Activities (C) | (1,249.79) | (523.47) | (1,120.33) | 282.00 |
| Net Increase / (Decrease) in Cash & Cash Equivalents | 20.28 | 7.90 | (66.18) | 69.48 |
| Closing Cash & Cash Equivalents | 260.84 | 243.61 | 304.59 | 373.85 |
Source: MRF Limited Standalone and Consolidated Cash Flow Statements
Board of Directors and Leadership Team
The Board of Directors comprises 14 members, including 5 Promoter Executive Directors, 2 Promoter Non-Executive Directors, and 7 Independent Directors.
Board Members and Executive Hierarchy
- K. M. Mammen: Chairman & Managing Director (Promoter Executive Director)
- Arun Mammen: Vice Chairman & Managing Director (Promoter Executive Director)
- Rahul Mammen Mappillai: Managing Director (Promoter Executive Director)
- Samir Thariyan Mappillai: Whole-Time Director (Promoter Executive Director)
- Varun Mammen: Whole-Time Director (Promoter Executive Director)
- Dr. (Mrs.) Cibi Mammen: Director (Promoter Non-Executive Director)
- Mrs. Ambika Mammen: Director (Promoter Non-Executive Director)
- Mrs. Vimla Abraham: Independent Director
- Mr. Vikram Taranath Hosangady: Independent Director
- Mr. Ramesh Rangarajan: Independent Director
- Mr. Dinshaw Keku Parakh: Independent Director
- Mr. Arun Vasu: Independent Director
- Mr. Vikram Chesetty: Independent Director
- Mr. Prasad Oommen: Independent Director
Board Committees and Composition
- Audit Committee: Comprises 3 Non-Executive Independent Directors: Vikram Taranath Hosangady (Chairman), Vikram Chesetty (Member), and Ramesh Rangarajan (Member).
- Nomination and Remuneration Committee: Comprises Ramesh Rangarajan (Chairman), Vikram Taranath Hosangady (Member), Vikram Chesetty (Member), and K. M. Mammen (Member).
- Stakeholders’ Relationship Committee: Comprises Arun Vasu (Chairman), K. M. Mammen (Member), and Arun Mammen (Member).
- Risk Management Committee: Comprises K. M. Mammen (Chairman), Arun Mammen (Member), Rahul Mammen Mappillai (Member), and Dinshaw Keku Parakh (Member).
- Corporate Social Responsibility (CSR) Committee: Comprises K. M. Mammen (Chairman), Arun Mammen (Member), Rahul Mammen Mappillai (Member), and Vikram Chesetty (Member).
Key Senior Management
Key Management Personnel and senior leadership include Madhu Plamootil Nainan (Executive Vice President – Finance), C. M. Cherian (Executive Vice President – R&D), Rajat Kumar Nangia (Executive Vice President – Marketing), Meera Mammen (Vice President – Welfare), Suresh T. Cherian (Vice President – ITS), P. John Mathew (Vice President – Engineering), Deepak Mathew (Vice President – Manufacturing), Abu Skaria Kandathil (Senior General Manager – Materials), and Thulsidass T. V. (appointed Vice President, General Counsel, Company Secretary & Compliance Officer effective 7th May 2026, succeeding S. Dhanvanth Kumar).
Subsidiaries, Associates, and Joint Ventures
The company has four direct operating subsidiaries, one step-down subsidiary, and one consolidated trust:
| Name of Entity | Country of Incorporation | Ownership % | Turnover (₹ Crores) | Profit After Tax (₹ Crores) |
|---|---|---|---|---|
| MRF Corp Ltd | India | 100.00% | 485.87 | 37.33 |
| MRF International Ltd | India | 94.66% | 0.18 | 0.13 |
| MRF Lanka (P) Ltd. | Sri Lanka | 100.00% | 15.39 | 2.75 |
| MRF SG PTE. LTD. | Singapore | 100.00% | 3,472.44 | 25.33 |
| MRF DB – FZCO (Step-Down Subsidiary) | United Arab Emirates | 100.00% | – | (0.03) |
| MRF Foundation (A Trust) | India | 100.00% | – | 2.55 |
Source: Form AOC-1 and Note 1 to Consolidated Financial Statements
The aggregate turnover of the four operating subsidiaries reached ₹3,974 Crores, with an aggregate profit after taxation of ₹66 Crores. The step-down entity MRF DB – FZCO was incorporated in the UAE on 7th May 2025 via MRF SG PTE. LTD., subscribing to 1,000 ordinary shares of nominal value AED 10 each.
Other Investments
MRF maintains financial investments categorized under non-current and current asset portfolios:
- Non-Current Quoted Investments: Equity shares held at fair value through profit or loss (FVTPL) valued at ₹17.16 Crores standalone (₹18.18 Crores consolidated); debt instruments (bonds) held at fair value through OCI valued at ₹322.71 Crores.
- Non-Current Unquoted Investments: Non-trade shares in co-operative societies and corpus entities held at transaction value of ₹0.07 Crores.
- Current Unquoted Investments: High-liquidity units of debt and arbitrage mutual funds (growth option) measured at FVTPL valued at ₹2,985.74 Crores on a standalone basis and ₹3,056.85 Crores on a consolidated basis.
Physical Properties and Manufacturing Locations
The enterprise conducts manufacturing across nine specialized regional plant hubs housing 10 production installations in India:
- Tiruvottiyur: Tiruvottiyur High Road, Chennai, Tamil Nadu.
- Kottayam: No. 2, Vadavathoor, Kottayam, Kerala.
- Goa: No. 1, Ponda, Goa.
- Arkonam: Arkonam – Tiruttani Road, Ichiputhur, Arkonam, Tamil Nadu.
- Medak: No. 2, Sadasivapet, Sangareddy, Telangana.
- Puducherry: Eripakkam Village, Nettapakkam Commune, Puducherry.
- Ankenpally: No. 2, Sadasivapet, Sangareddy, Telangana.
- Perambalur (2 plants): Naranamangalam Village & Post, Alathur Taluk, Perambalur District, Tamil Nadu.
- Dahej: Plot No. D-II-16, Dahej Industrial Area, Galenda Village, Taluka – Vagara, Bharuch District, Gujarat.
The registered headquarters is located at No. 114, Greams Road, Chennai, Tamil Nadu.
Parent Company Details
MRF Limited is not a subsidiary of another corporate body; it is the ultimate parent entity of the MRF Group.
Investments and Capital Expenditure Plans
During the financial year 2025-26, the company deployed ₹1,427.91 Crores in standalone capital expenditure on Property, Plant and Equipment (consolidated capex was ₹1,434.25 Crores). Outstanding commitments for capital contracts remaining to be executed (net of advances) stood at ₹1,513.75 Crores as of 31st March 2026, up from ₹714.11 Crores in the previous year.
Research and development expenditure for FY 2025-26 totaled ₹483.27 Crores (compared to ₹225.50 Crores in FY 2024-25), broken down as follows:
- Capital R&D Expenditure: ₹254.77 Crores (including ₹179.88 Crores for construction of a dedicated vehicle test track).
- Revenue R&D Expenditure: ₹228.50 Crores.
Shareholding Pattern
The authorized share capital is ₹10.00 Crores, divided into 9,000,000 equity shares of ₹10 each and 100,000 redeemable cumulative preference shares of ₹100 each. The issued, subscribed, and paid-up equity capital stands at ₹4.24 Crores, representing 4,241,143 equity shares of ₹10 each (excluding 71 unallotted bonus shares).
Distribution of Shareholding as of 31st March 2026
| Shareholding Slab | Number of Shareholders | % of Shareholders | Number of Shares | % of Shares |
|---|---|---|---|---|
| Upto 100 | 56,507 | 97.24% | 351,680 | 8.29% |
| 101 – 500 | 1,157 | 1.99% | 243,947 | 5.75% |
| 501 – 1,000 | 161 | 0.28% | 115,426 | 2.72% |
| 1,001 – 2,000 | 112 | 0.19% | 163,208 | 3.85% |
| 2,001 – 3,000 | 49 | 0.08% | 122,367 | 2.89% |
| 3,001 – 4,000 | 19 | 0.03% | 66,024 | 1.56% |
| 4,001 – 5,000 | 12 | 0.02% | 54,829 | 1.29% |
| 5,001 – 10,000 | 38 | 0.07% | 270,098 | 6.37% |
| 10,001 and above | 55 | 0.10% | 2,853,564 | 67.28% |
| Total | 58,110 | 100.00% | 4,241,143 | 100.00% |
Source: Section 13(g) of Report on Corporate Governance
Shareholders Holding More Than 5%
| Name of Shareholder | As at 31.03.2026 (Shares) | As at 31.03.2026 (%) | As at 31.03.2025 (Shares) | As at 31.03.2025 (%) |
|---|---|---|---|---|
| Comprehensive Investment and Finance Co. Pvt. Ltd. | 441,834 | 10.42% | 441,834 | 10.42% |
| MOWI Foundation | 507,984 | 11.98% | 507,984 | 11.98% |
Source: Statement of Changes in Equity (SOCE)
The entire Promoter and Promoter Group holding as of 31st March 2026 comprises 1,177,931 shares, which represents 27.77% of the total equity base (calculated by FirmsWorld from disclosed share figures). Additionally, 99.35% of the company’s equity capital is held in dematerialized form (89.61% via NSDL and 9.74% via CDSL), while 0.65% remains in physical format.
Future Strategy
MRF’s corporate and operational roadmap focuses on market positioning, sustainability targets, and segment upgrades:
- Electric Mobility Adaptation: Expanding fitment on next-generation electric passenger cars, electric buses, and electric two-wheelers through specialized rolling resistance and acoustic absorption technologies.
- Regulatory & Standard Compliance: Preparing for the second phase of Automotive Industry Standard (AIS) 142 norms scheduled for implementation in the second half of FY 2026-27, which will drive migration from traditional nylon tyres toward compliant low-noise radials in truck segments.
- Export Market Penetration: Accelerating distribution expansions across Africa, South East Asia, Europe, and the Americas, building on initial marketing traction from the Latin Tyre & Auto Parts Expo in Panama.
- Decarbonisation and Renewable Transition: Expanding renewable energy sourcing from the achieved 30% operational share toward higher carbon neutrality targets, implementing biomass blending in industrial steam generation, and shifting to hydraulic systems to curb compressor energy consumption.
- Circular Product Development: Increasing the ratio of sustainable, bio-based, and circular recycled raw materials incorporated across tyre lines without sacrificing tread durability or traction safety.
Key Strengths
- Long-Standing Market Leadership: Defending the top tyre manufacturer position in India for roughly four decades across both replacement channels and OEM factory relationships.
- Financial Position and Liquidity: Maintains a low debt-equity ratio of 0.02, total equity of ₹20,974.75 Crores, and independent credit ratings of CARE AAA (Stable) and CARE A1+.
- In-House Technology and Product Range: Independence from foreign technical collaboration, supported by in-house R&D that built specialized high-speed ‘W’ rated superbike radials and dedicated EV acoustic solutions.
- Broad Manufacturing and Supply Reach: 10 production centers across India connected by SAP-driven integrated enterprise networks and dedicated distribution channels.
Key Challenges and Risks
- Geopolitical and Supply Chain Disruptions: Unrest in the Middle East, such as the conflict in Iran, causes supply route blockages, raises freight rates, and increases procurement costs for petrochemical inputs.
- Raw Material Cost Pressures: Volatile pricing in basic feedstocks—including natural rubber, synthetic polymers, compound rubber, and carbon black. Standalone raw material consumption climbed to ₹18,740.53 Crores in FY 2025-26.
- Agricultural Demand Exposure: Tractor and agro-tyre sales remain susceptible to below-normal monsoons and El Niño weather patterns.
- Regulatory and Compliance Dues: Continued legal exposure under the Competition Commission of India penalty proceedings of ₹622.09 Crores, currently before the Supreme Court, alongside disputed tax demands under appeal totaling ₹243.65 Crores for sales tax, ₹112.57 Crores for income tax, and ₹64.08 Crores for excise/customs duties.
- Currency Depreciation: Depreciation of the Indian Rupee increases import landed costs for overseas raw materials, components, and equipment.
Conclusion and Strategic Outlook
MRF Limited completed the 2025-26 fiscal year with consolidated revenues reaching ₹31,149.01 Crores and consolidated profit after tax of ₹2,426.10 Crores. Supported by a healthy domestic automotive market, product introductions across superbike, EV, and commercial applications, and a low debt-equity ratio of 0.02, the company continues to maintain its operating position while addressing raw material costs, regulatory updates, and geopolitical headwinds.
For more corporate details and investor disclosures, visit the official site: MRF Tyres Official Website.