Here you get to know about the Nifty Energy Index, List of Stocks in the Energy Index, Companies with Weightage. The Nifty Energy Index comprises 10 companies listed on National Stock Exchange of India (NSE).
NIFTY Energy Index
NIFTY Energy Index is computed using free float market capitalization method, wherein the level of the index reflects the total free-float market value of all the stocks in the index relative to particular base market capitalization value.
NIFTY Energy sector Index includes companies belonging to
- Petroleum,
- Gas and
- Power sectors.
NIFTY Energy Index can be used for a variety of purposes such as benchmarking fund portfolios, launching of index funds, ETFs and structured products.
- Base Date: January 01, 2004
- Base Value: 1000
- Launch Date: September 07, 2011
- No of Constituents: 20
The index is re-balanced on a semi-annual basis. The cut-off date is January 31 and July 31 of each year
Nifty Energy Stocks Top constituents by weightage
This is the list of Companies with weightage from the Energy index. The Weightage of each stock is given which is in order from high weightage to Low. Reliance Industries Limited is the Stock with highest weightage in the Index.


![Adani Green Energy Limited [AGEL] Subsidiaries](https://indiancompanies.in/wp-content/uploads/2020/06/renewable-energy.jpg)

- Reliance Industries Ltd. 31.30 % Stock Weightage
- NTPC Ltd. 13.29 % Stock Weightage
- Power Grid Corporation of India Ltd. 11.23 % Stock Weightage
- Oil & Natural Gas Corporation Ltd. 10.97 % Stock Weightage
- Bharat Petroleum Corporation Ltd. 9.89 % Stock Weightage
- Indian Oil Corporation Ltd. 8.00 % Stock Weightage
- GAIL (India) Ltd. 5.61 % Stock Weightage
- Hindustan Petroleum Corporation Ltd. 4.95 % Stock Weightage
- Tata Power Co. Ltd. 2.45 % Stock Weightage
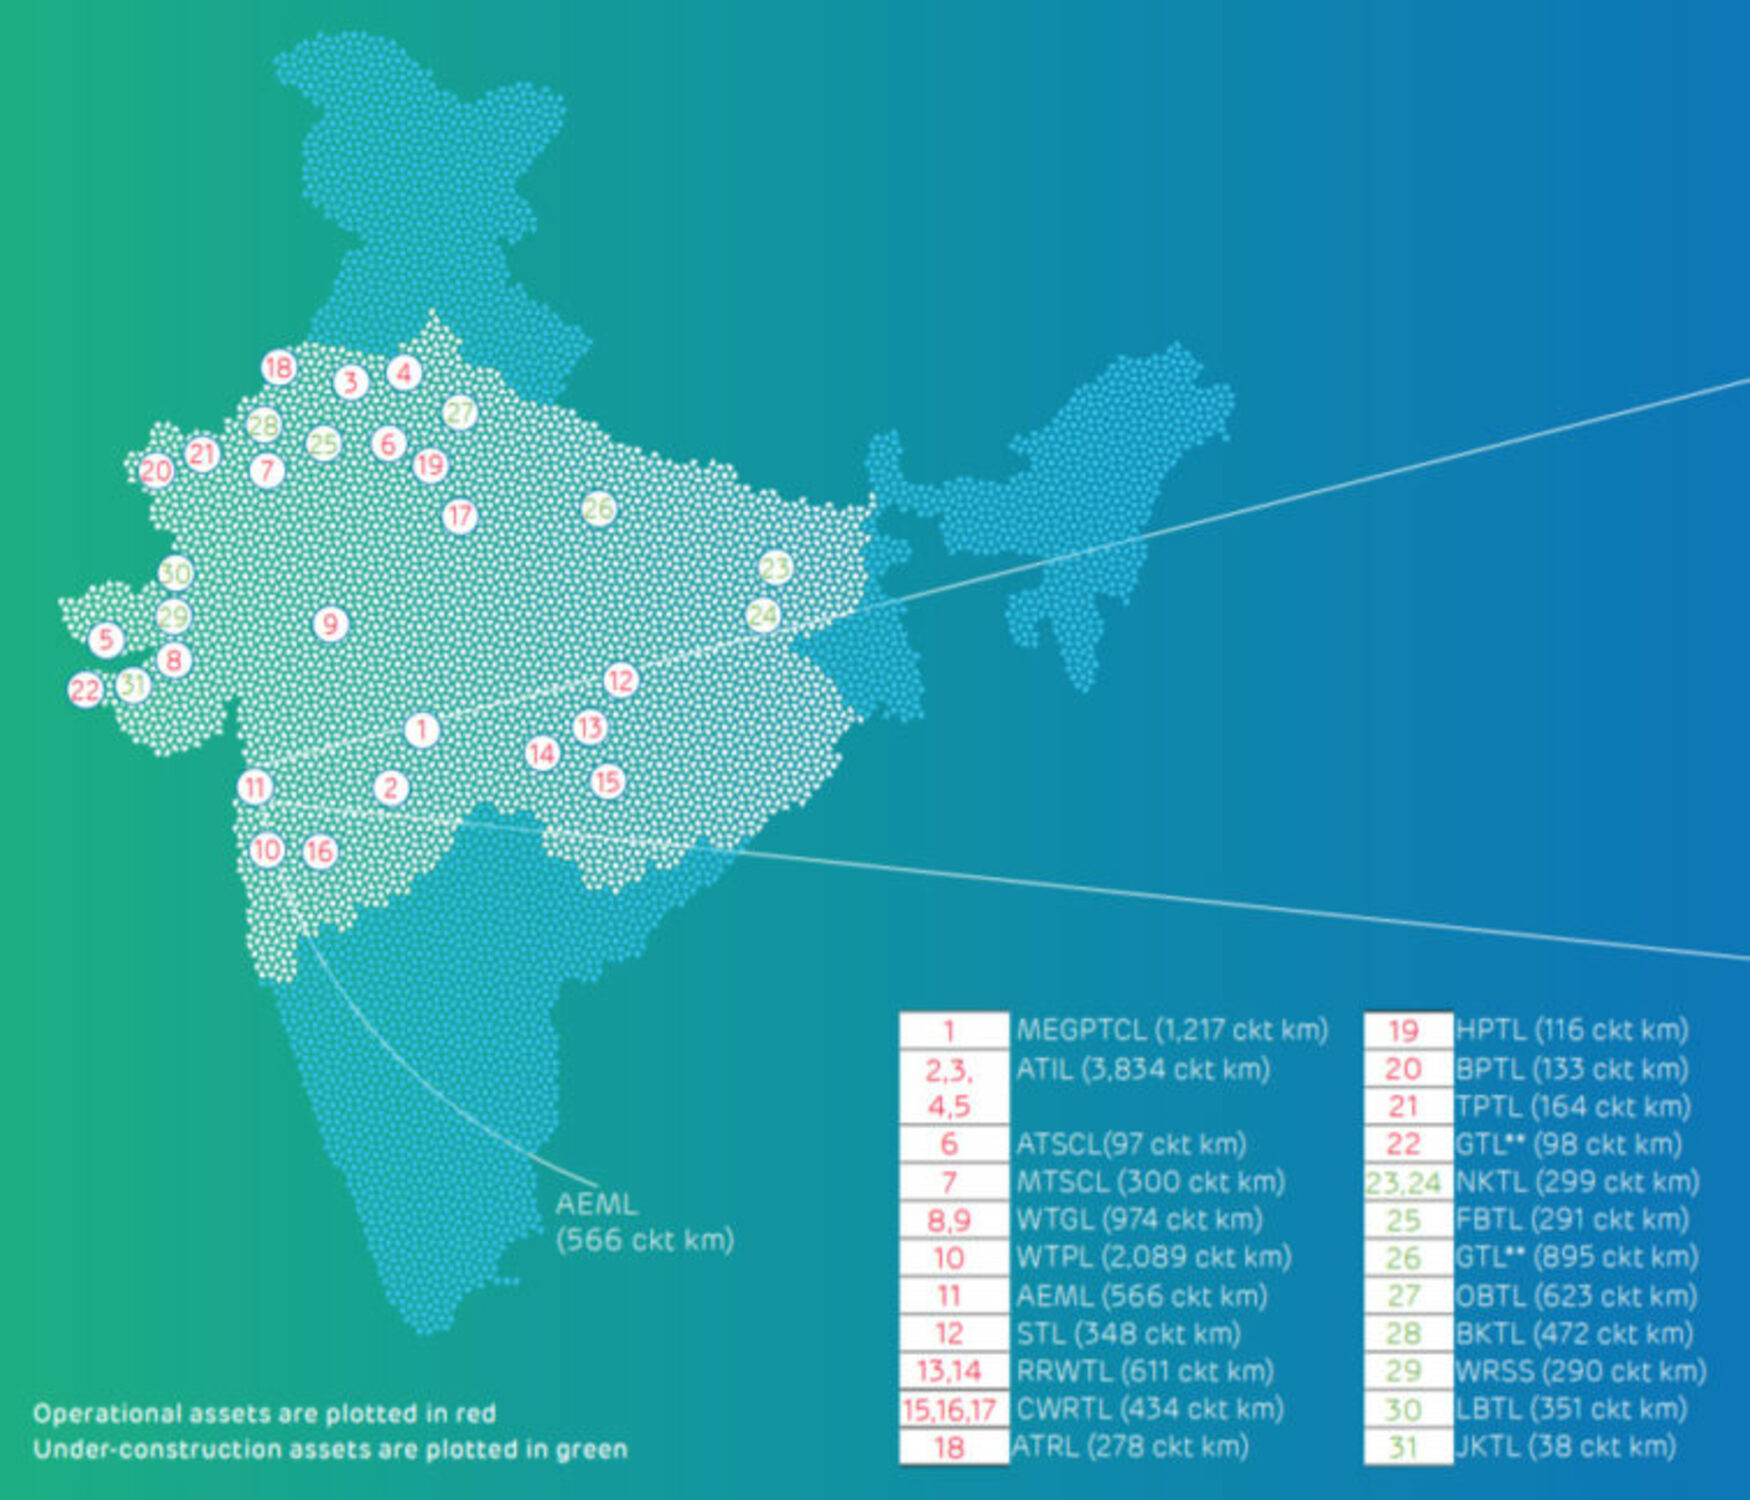
- Adani Transmission Ltd. 2.29 % Stock Weightage
Weightage of each stock in the index is be calculated based on its free-float market capitalization such that no single stock shall be more than 34% and weightage of the top 3 stocks cumulatively shall not be more than 63% at the time of rebalancing.
Fundamental PE (P/E) and PB (P/B) Ratio and Dividend Yield of Energy index
So here is the average Fundamental PE (P/E) and PB (P/B) Ratio and Dividend Yield of Energy index
- P/E: 12.42
- P/B: 1.64
- Dividend Yield: 3.25
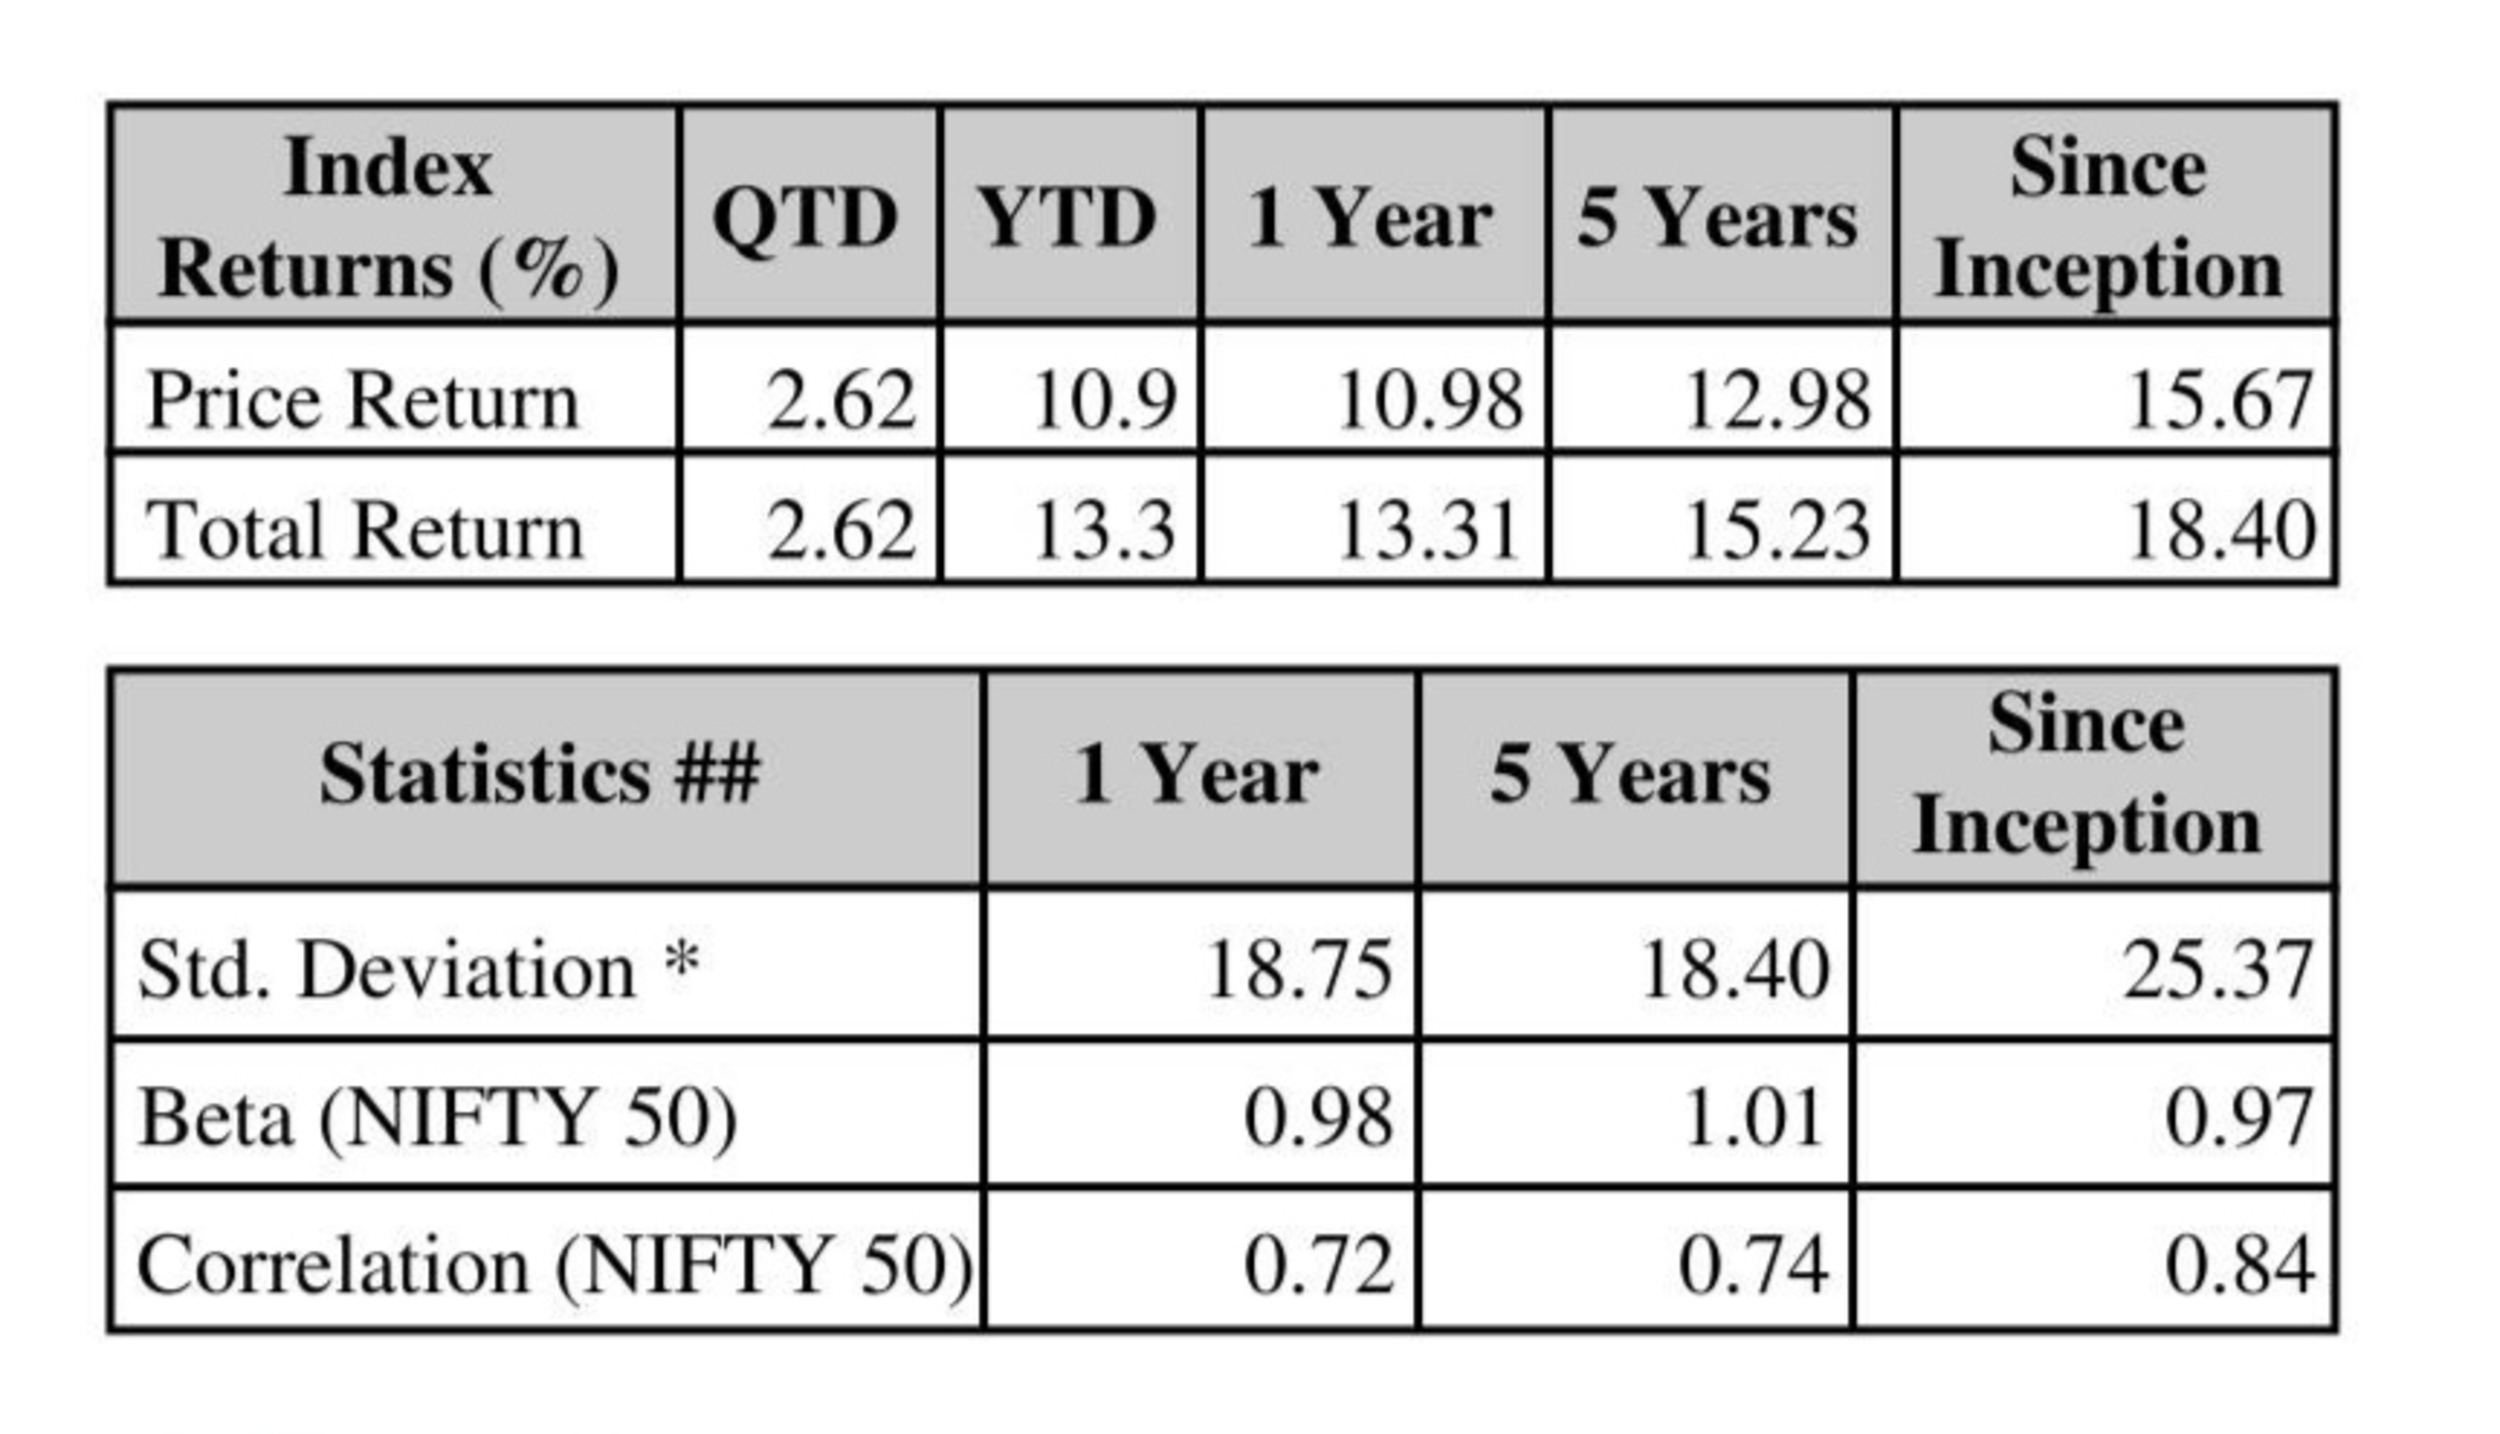
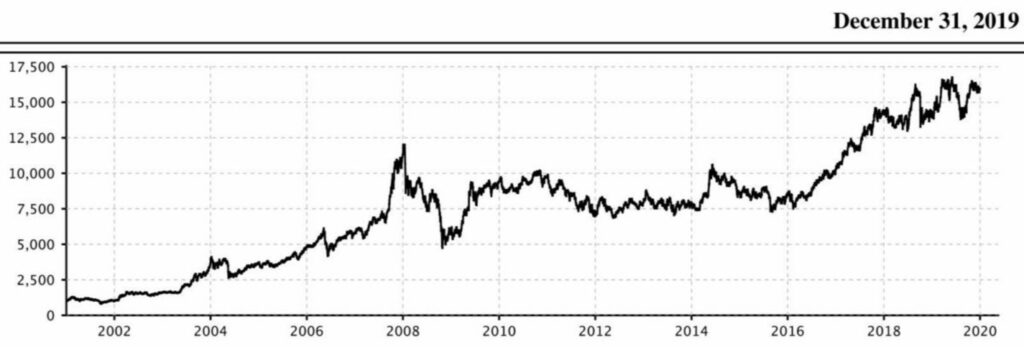
Energy Index Historical Data Chart with Return
The index has given a total return of 18.4 % CAGR for the last 19 years from the year 2001 to 2019.
This is the Chart that shows the return from 2001 to 2009. The base date is 1000
Nifty Energy Stocks List With Symbol
so here is the complete List of stocks from Nifty Energy Index.
| Company Name | Symbol |
| Adani Transmission Ltd. | ADANITRANS |
| Bharat Petroleum Corporation Ltd. | BPCL |
| GAIL (India) Ltd. | GAIL |
| Hindustan Petroleum Corporation Ltd. | HINDPETRO |
| Indian Oil Corporation Ltd. | IOC |
| NTPC Ltd. | NTPC |
| Oil & Natural Gas Corporation Ltd. | ONGC |
| Power Grid Corporation of India Ltd. | POWERGRID |
| Reliance Industries Ltd. | RELIANCE |
| Tata Power Co. Ltd. | TATAPOWER |